🔎 Recent snapshot
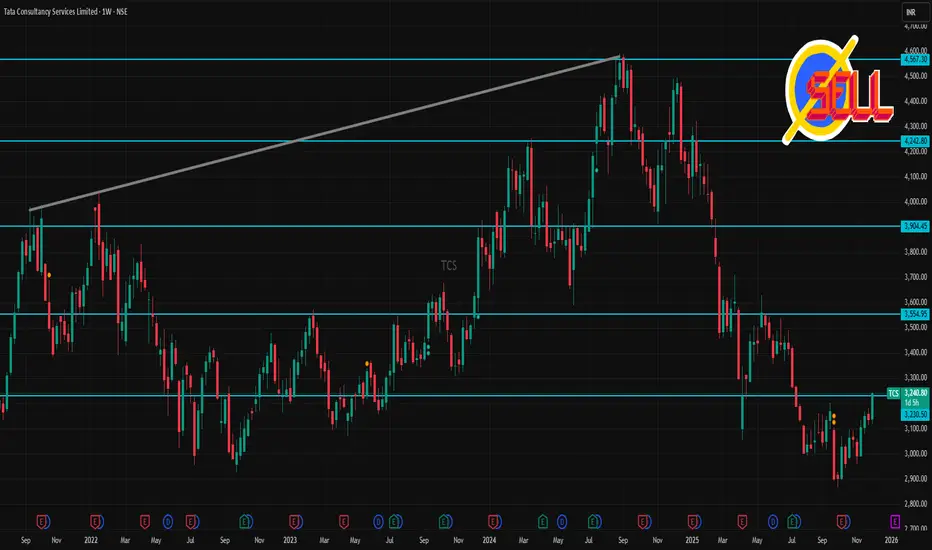
According to a recent technical‑analysis update, TCS has support near ₹2,970–₹2,870 and resistance near ₹3,170, ₹3,207, ₹3,270 on the shorter‑term charts.
On a weekly / medium‑term view, some oversold‑indicator signals have been flagged, suggesting the stock could attempt a rebound if support holds.
Analysts’ longer‑term target (12‑month) sits around ₹3,505–₹3,470, implying moderate upside from current levels.
⚠️ What could derail upside
If the stock falls below the lower support of ~₹2,870‑₹2,950, it may test deeper support zones.
Mixed signals from oscillators (some suggest bearish momentum) could limit strong short‑term rallies.
🎯 My take (for 1‑week traders)
TCS seems to be in a consolidation/neutral posture — the next few days could be defined by support‑vs‑resistance play. If you trade short‑term, the ~₹3,030–₹3,170 band defines a likely “play zone.” A decisive move beyond that could hint at short‑term trend direction.
관련 발행물
면책사항
해당 정보와 게시물은 금융, 투자, 트레이딩 또는 기타 유형의 조언이나 권장 사항으로 간주되지 않으며, 트레이딩뷰에서 제공하거나 보증하는 것이 아닙니다. 자세한 내용은 이용 약관을 참조하세요.
관련 발행물
면책사항
해당 정보와 게시물은 금융, 투자, 트레이딩 또는 기타 유형의 조언이나 권장 사항으로 간주되지 않으며, 트레이딩뷰에서 제공하거나 보증하는 것이 아닙니다. 자세한 내용은 이용 약관을 참조하세요.