📊 Weekly Technical Overview
Current Price: ₹3,004.80 (NSE)
Weekly Performance: +3.57%
Year-to-Date Performance: −26.69%
52-Week High: ₹4,592.25 (Aug 30, 2024)
52-Week Low: ₹2,888.40
🔍 Key Technical Indicators
Moving Averages:
5-Day MA: ₹3,018.94 (Sell)
50-Day MA: ₹2,980.76 (Buy)
200-Day MA: ₹3,046.08 (Sell)
Relative Strength Index (RSI): Currently at 40, indicating a neutral stance.
MACD: Bearish crossover observed, suggesting downward momentum.
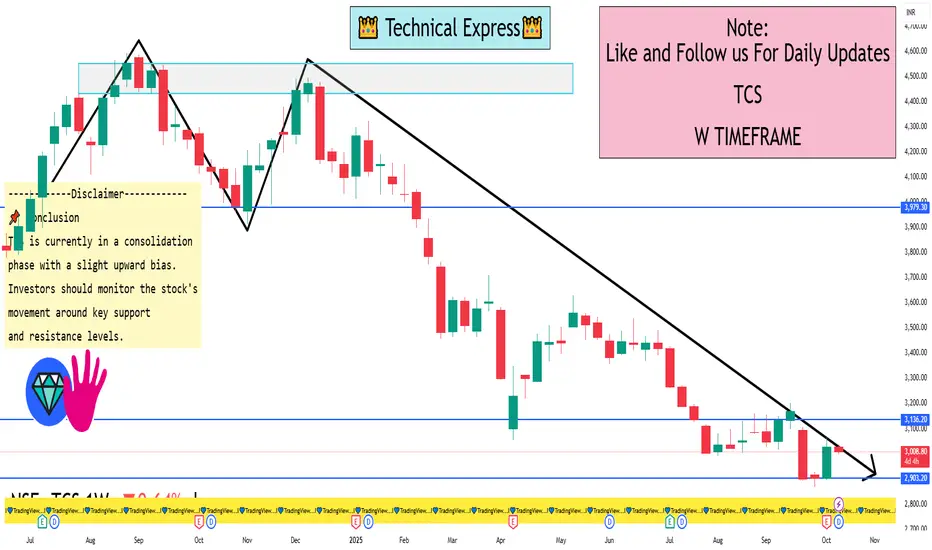
Support Levels: ₹2,888.40
Resistance Levels: ₹3,176.70
📌 Conclusion
TCS is currently in a consolidation phase with a slight upward bias. Investors should monitor the stock's movement around key support and resistance levels. A break below ₹2,888.40 could signal further downside, while a rise above ₹3,176.70 may indicate a potential trend reversal.
Current Price: ₹3,004.80 (NSE)
Weekly Performance: +3.57%
Year-to-Date Performance: −26.69%
52-Week High: ₹4,592.25 (Aug 30, 2024)
52-Week Low: ₹2,888.40
🔍 Key Technical Indicators
Moving Averages:
5-Day MA: ₹3,018.94 (Sell)
50-Day MA: ₹2,980.76 (Buy)
200-Day MA: ₹3,046.08 (Sell)
Relative Strength Index (RSI): Currently at 40, indicating a neutral stance.
MACD: Bearish crossover observed, suggesting downward momentum.
Support Levels: ₹2,888.40
Resistance Levels: ₹3,176.70
📌 Conclusion
TCS is currently in a consolidation phase with a slight upward bias. Investors should monitor the stock's movement around key support and resistance levels. A break below ₹2,888.40 could signal further downside, while a rise above ₹3,176.70 may indicate a potential trend reversal.
I built a Buy & Sell Signal Indicator with 85% accuracy.
📈 Get access via DM or
WhatsApp: wa.link/d997q0
Contact - +91 76782 40962
| Email: techncialexpress@gmail.com
| Script Coder | Trader | Investor | From India
📈 Get access via DM or
WhatsApp: wa.link/d997q0
Contact - +91 76782 40962
| Email: techncialexpress@gmail.com
| Script Coder | Trader | Investor | From India
관련 발행물
면책사항
해당 정보와 게시물은 금융, 투자, 트레이딩 또는 기타 유형의 조언이나 권장 사항으로 간주되지 않으며, 트레이딩뷰에서 제공하거나 보증하는 것이 아닙니다. 자세한 내용은 이용 약관을 참조하세요.