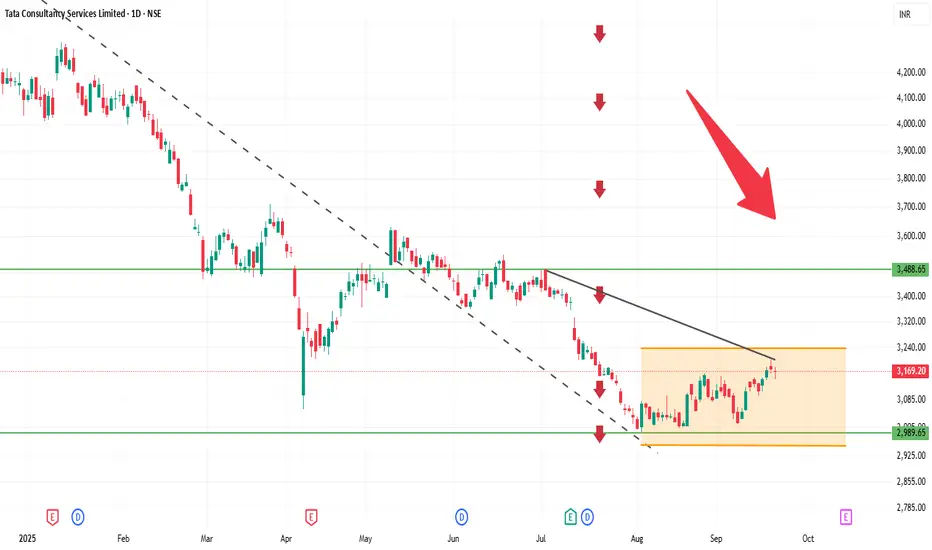
Current Price: Around 3,174
Current Trend: Stock is in a sideways to slightly bullish phase after consolidation.
Support Zone: Strong support at 3,140 – 3,150. Buyers may defend this level.
Resistance Zone: Key resistance at 3,200 – 3,220. A breakout above 3,220 can trigger fresh upside.
Indicators: Daily candles indicate mild buying interest; volume is stable.
Outlook:
Above 3,220 → bullish momentum may extend toward 3,250+.
Below 3,140 → weakness may push toward 3,100–3,120.
👉 In short:
Range: 3,140 – 3,220.
Neutral to slightly bullish; breakout will determine next move.
관련 발행물
면책사항
해당 정보와 게시물은 금융, 투자, 트레이딩 또는 기타 유형의 조언이나 권장 사항으로 간주되지 않으며, 트레이딩뷰에서 제공하거나 보증하는 것이 아닙니다. 자세한 내용은 이용 약관을 참조하세요.
관련 발행물
면책사항
해당 정보와 게시물은 금융, 투자, 트레이딩 또는 기타 유형의 조언이나 권장 사항으로 간주되지 않으며, 트레이딩뷰에서 제공하거나 보증하는 것이 아닙니다. 자세한 내용은 이용 약관을 참조하세요.