📈 Daily Pivot Levels
Calculated using standard pivot point analysis, the key levels are:
Pivot Point (PP): ₹727.12
Support Levels:
S1: ₹715.38
S2: ₹707.77
S3: ₹696.03
Resistance Levels:
R1: ₹734.73
R2: ₹746.47
R3: ₹757.21
These levels suggest that the stock is trading above the pivot point, indicating a bullish sentiment.
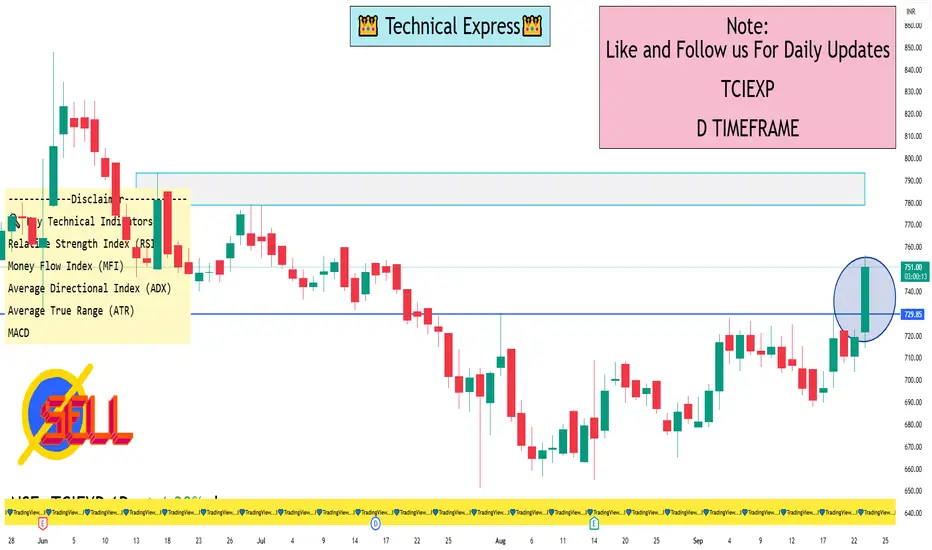
🔍 Key Technical Indicators
Relative Strength Index (RSI): 57.20, indicating neutral momentum.
Money Flow Index (MFI): 42.84, suggesting a balanced buying and selling pressure.
MACD: 3.07, with a signal line at 1.32, indicating a bullish crossover.
Average Directional Index (ADX): 14.91, reflecting a weak trend strength.
Average True Range (ATR): ₹19.41, indicating moderate volatility.
These indicators collectively point towards a cautious bullish outlook, with the stock showing potential for upward movement but lacking strong momentum.
📊 Fibonacci Retracement Levels
Based on recent price movements, key Fibonacci levels are:
Retracement Levels:
23.6%: ₹714.58
38.2%: ₹705.11
50%: ₹697.45
61.8%: ₹689.79
Projection Levels:
23.6%: ₹734.82
38.2%: ₹744.29
50%: ₹751.95
61.8%: ₹759.61
The stock is currently trading above the 23.6% retracement level, suggesting potential for further upward movement towards the projection levels.
📌 Summary
TCI Express Ltd. is currently trading at ₹749.40, above the pivot point of ₹727.12, indicating a bullish sentiment. The stock is showing potential for upward movement towards the resistance levels, with key indicators supporting this outlook. However, the weak ADX suggests that the trend strength is not strong, and investors should monitor the stock closely for any signs of reversal or breakout.
Calculated using standard pivot point analysis, the key levels are:
Pivot Point (PP): ₹727.12
Support Levels:
S1: ₹715.38
S2: ₹707.77
S3: ₹696.03
Resistance Levels:
R1: ₹734.73
R2: ₹746.47
R3: ₹757.21
These levels suggest that the stock is trading above the pivot point, indicating a bullish sentiment.
🔍 Key Technical Indicators
Relative Strength Index (RSI): 57.20, indicating neutral momentum.
Money Flow Index (MFI): 42.84, suggesting a balanced buying and selling pressure.
MACD: 3.07, with a signal line at 1.32, indicating a bullish crossover.
Average Directional Index (ADX): 14.91, reflecting a weak trend strength.
Average True Range (ATR): ₹19.41, indicating moderate volatility.
These indicators collectively point towards a cautious bullish outlook, with the stock showing potential for upward movement but lacking strong momentum.
📊 Fibonacci Retracement Levels
Based on recent price movements, key Fibonacci levels are:
Retracement Levels:
23.6%: ₹714.58
38.2%: ₹705.11
50%: ₹697.45
61.8%: ₹689.79
Projection Levels:
23.6%: ₹734.82
38.2%: ₹744.29
50%: ₹751.95
61.8%: ₹759.61
The stock is currently trading above the 23.6% retracement level, suggesting potential for further upward movement towards the projection levels.
📌 Summary
TCI Express Ltd. is currently trading at ₹749.40, above the pivot point of ₹727.12, indicating a bullish sentiment. The stock is showing potential for upward movement towards the resistance levels, with key indicators supporting this outlook. However, the weak ADX suggests that the trend strength is not strong, and investors should monitor the stock closely for any signs of reversal or breakout.
I built a Buy & Sell Signal Indicator with 85% accuracy.
📈 Get access via DM or
WhatsApp: wa.link/d997q0
Contact - +91 76782 40962
| Email: techncialexpress@gmail.com
| Script Coder | Trader | Investor | From India
📈 Get access via DM or
WhatsApp: wa.link/d997q0
Contact - +91 76782 40962
| Email: techncialexpress@gmail.com
| Script Coder | Trader | Investor | From India
관련 발행물
면책사항
해당 정보와 게시물은 금융, 투자, 트레이딩 또는 기타 유형의 조언이나 권장 사항으로 간주되지 않으며, 트레이딩뷰에서 제공하거나 보증하는 것이 아닙니다. 자세한 내용은 이용 약관을 참조하세요.