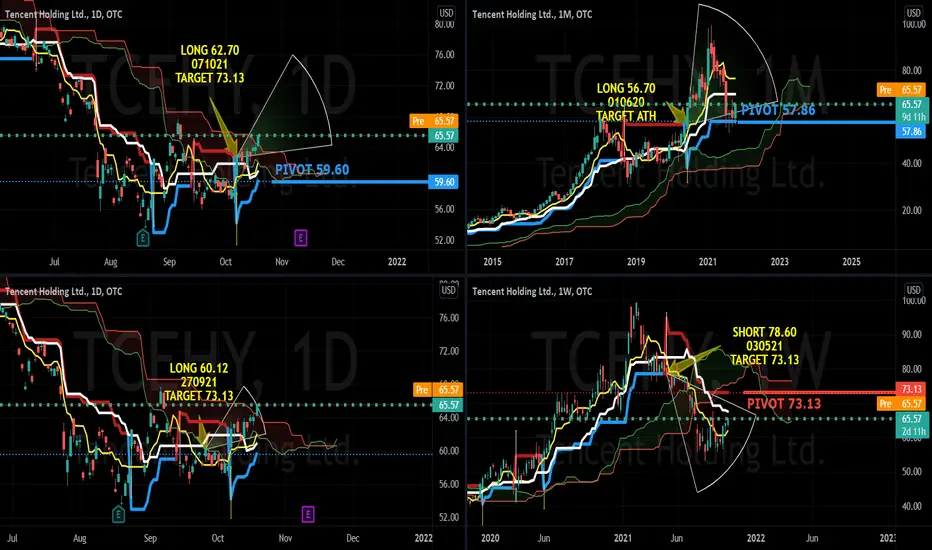
TCEHY has been on a medium term downtrend since 030521 since the short signal issued at $78.60. The long term charts is still long from 010620 at $56.70. A break above the weekly supertrend resistance at $73.13 may resume the uptrend supported by a long signal on the day charts at $62.70 on 071021
Long Term UPTREND since 010620
Medium Term DOWNTREND since 030521
Short Term BASEFORMING since 071021
PIVOT 73.13
Short positions below 73.13 for 59.60 and 41.26
Long positions above 73.13 for 99.40 and new ATH
Long Term UPTREND since 010620
Medium Term DOWNTREND since 030521
Short Term BASEFORMING since 071021
PIVOT 73.13
Short positions below 73.13 for 59.60 and 41.26
Long positions above 73.13 for 99.40 and new ATH
Quant Strategic Singapore
면책사항
해당 정보와 게시물은 금융, 투자, 트레이딩 또는 기타 유형의 조언이나 권장 사항으로 간주되지 않으며, 트레이딩뷰에서 제공하거나 보증하는 것이 아닙니다. 자세한 내용은 이용 약관을 참조하세요.
Quant Strategic Singapore
면책사항
해당 정보와 게시물은 금융, 투자, 트레이딩 또는 기타 유형의 조언이나 권장 사항으로 간주되지 않으며, 트레이딩뷰에서 제공하거나 보증하는 것이 아닙니다. 자세한 내용은 이용 약관을 참조하세요.