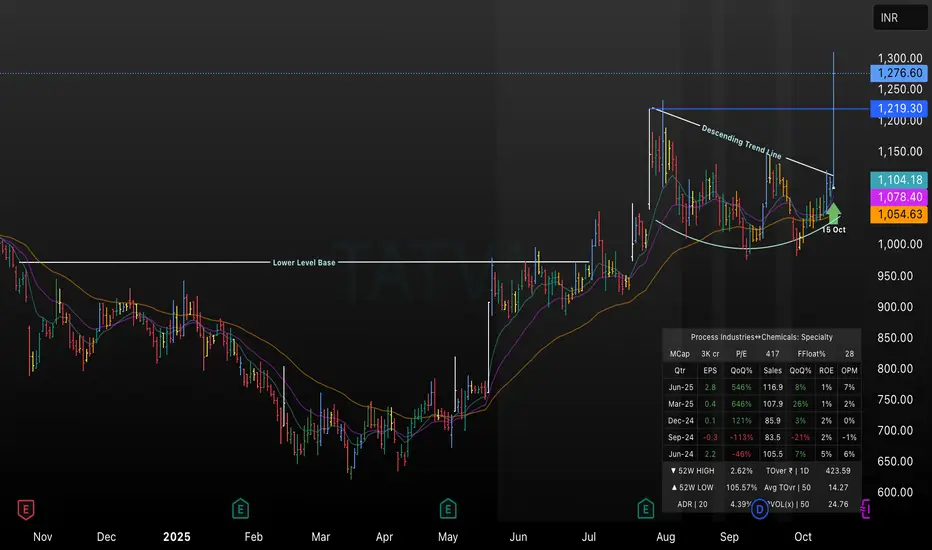
This TradingView chart highlights Tatva’s price action as it breaks above a descending trend line on October 15, 2025, signaling a strong bullish move. Key levels such as the lower base, breakout zone, and price targets (₹1219.30, ₹1276.60, ₹1300.00) are marked, with EMA indicators supporting positive momentum. The chart includes recent fundamentals, making it ideal for technical traders analyzing breakout setups and trend reversals in specialty chemicals stocks for Q4 2025
면책사항
이 정보와 게시물은 TradingView에서 제공하거나 보증하는 금융, 투자, 거래 또는 기타 유형의 조언이나 권고 사항을 의미하거나 구성하지 않습니다. 자세한 내용은 이용 약관을 참고하세요.
면책사항
이 정보와 게시물은 TradingView에서 제공하거나 보증하는 금융, 투자, 거래 또는 기타 유형의 조언이나 권고 사항을 의미하거나 구성하지 않습니다. 자세한 내용은 이용 약관을 참고하세요.