🔍 Current context
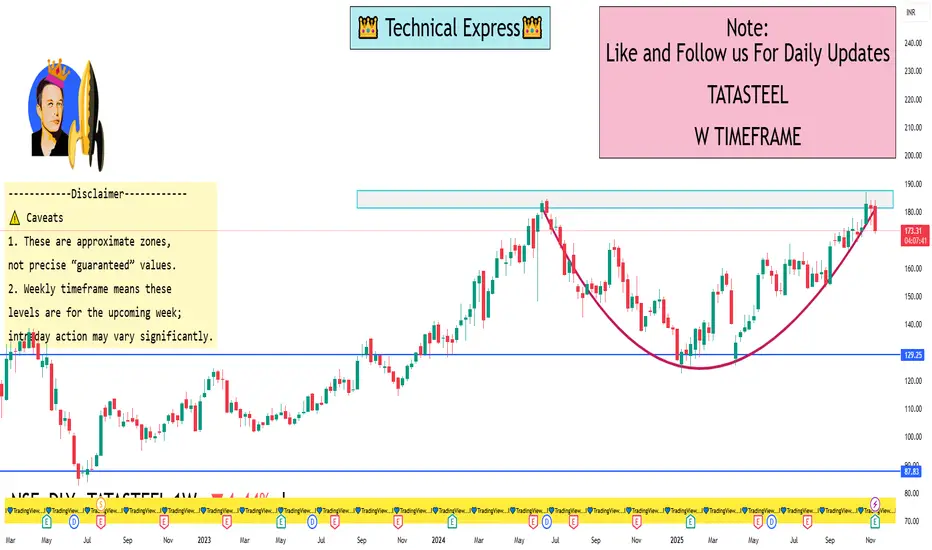
The stock is trading around ₹ 176–177 (as of mid-Nov 2025).
On a weekly basis, technical indicators suggest a mixed to weak bias: for example, on daily timeframes many moving averages and indicators show “Sell” signals.
On the weekly timeframe (Moneycontrol data) the moving averages, MACD, RSI etc are showing outperform (“bullish”) signals.
Key support/resistance pivot levels:
Resistance (Classic) ~ ₹ 185.31, ₹ 189.25, ₹ 194.40
Support (Classic) ~ ₹ 176.22, ₹ 171.07, ₹ 167.13
52‐week high ~ ₹ 186.94, 52‐week low ~ ₹ 122.62
🎯 1-Week Trading Levels & Potential Strategy
Given the above, here are plausible levels and scenarios for the next week:
Upside target: If the stock picks up momentum, a breakout above ~ ₹ 180-185 opens the way toward ~ ₹ 189-190 (resistance).
Downside risk: If weakness persists, a drop below ~ ₹ 176 could test support around ~ ₹ 171–172, and potentially down to ~ ₹ 167.
Key trigger level: The ~ ₹ 176 region is a hinge. Holding above gives chance for upside; failing it shifts the bias downward.
⚠️ Caveats
A 1-week timeframe is quite short; factors such as global steel demand, raw material costs, and domestic policy can impact quickly.
Technicals are only one piece of the puzzle — fundamentals, news, sector dynamics matter.
The conflicting signals (daily weak vs weekly stronger) mean the stock may trade sideways or range-bound in the short run.
I built a Buy & Sell Signal Indicator with 85% accuracy.
📈 Get access via DM or
WhatsApp: wa.link/d997q0
Contact - +91 76782 40962
| Email: techncialexpress@gmail.com
| Script Coder | Trader | Investor | From India
📈 Get access via DM or
WhatsApp: wa.link/d997q0
Contact - +91 76782 40962
| Email: techncialexpress@gmail.com
| Script Coder | Trader | Investor | From India
관련 발행물
면책사항
해당 정보와 게시물은 금융, 투자, 트레이딩 또는 기타 유형의 조언이나 권장 사항으로 간주되지 않으며, 트레이딩뷰에서 제공하거나 보증하는 것이 아닙니다. 자세한 내용은 이용 약관을 참조하세요.