⚡ Tata Power – Bullish Reversal Pattern on Daily Chart
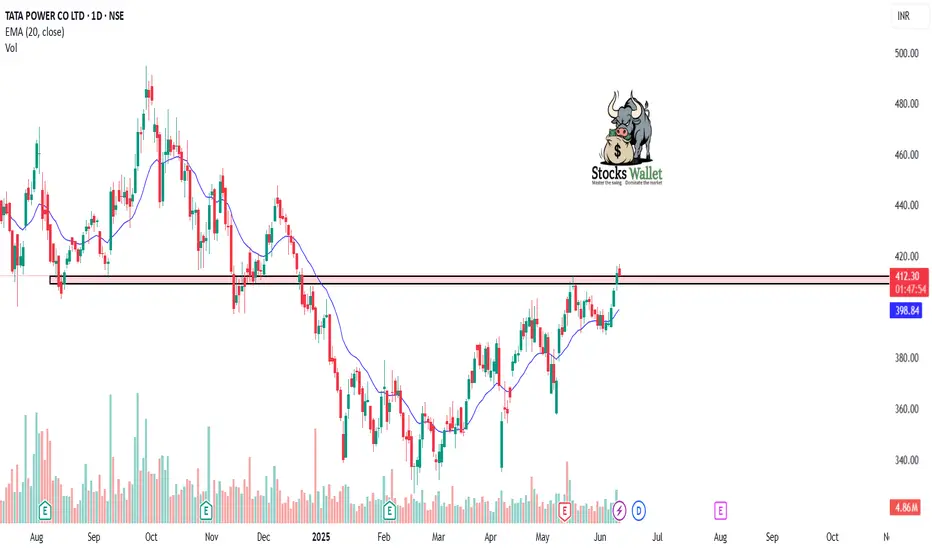
Chart: Tata Power – Daily Timeframe
Tata Power has formed a strong bullish reversal setup after retesting a key support zone near ₹420. The stock has shown strong buying interest with rising volume and a bullish engulfing candle, indicating a potential start of a new upward leg.
🔹 Technical Highlights:
Price bounced from previous swing support (₹420–₹425)
Bullish engulfing candle + volume surge = strong buyer presence
RSI reversing from 50 zone and trending upward
20 EMA acting as dynamic support
📌 Trade Plan:
Entry Zone: ₹430–435
Target 1: ₹450
Target 2: ₹470
Stop Loss: Below ₹420 (closing basis)
The broader trend remains positive, and this could be the beginning of a new up-move. A breakout above ₹440 on strong volume would further confirm the bullish trend continuation.
⚠️ This analysis is for educational purposes only. Please do your own research before trading.
면책사항
해당 정보와 게시물은 금융, 투자, 트레이딩 또는 기타 유형의 조언이나 권장 사항으로 간주되지 않으며, 트레이딩뷰에서 제공하거나 보증하는 것이 아닙니다. 자세한 내용은 이용 약관을 참조하세요.
면책사항
해당 정보와 게시물은 금융, 투자, 트레이딩 또는 기타 유형의 조언이나 권장 사항으로 간주되지 않으며, 트레이딩뷰에서 제공하거나 보증하는 것이 아닙니다. 자세한 내용은 이용 약관을 참조하세요.