On the 1-hour chart, Tata Motors exhibits a neutral trend, indicating indecision in the short term. Key technical indicators are as follows:
Relative Strength Index (RSI): Approximately 50, suggesting balanced buying and selling pressures.
Moving Averages: The stock is trading near its short-term moving averages, with no clear bullish or bearish crossover.
Volume: Trading volume is consistent with recent averages, showing no significant spikes.
Given these indicators, the stock is consolidating within a range, awaiting a catalyst for a directional move.
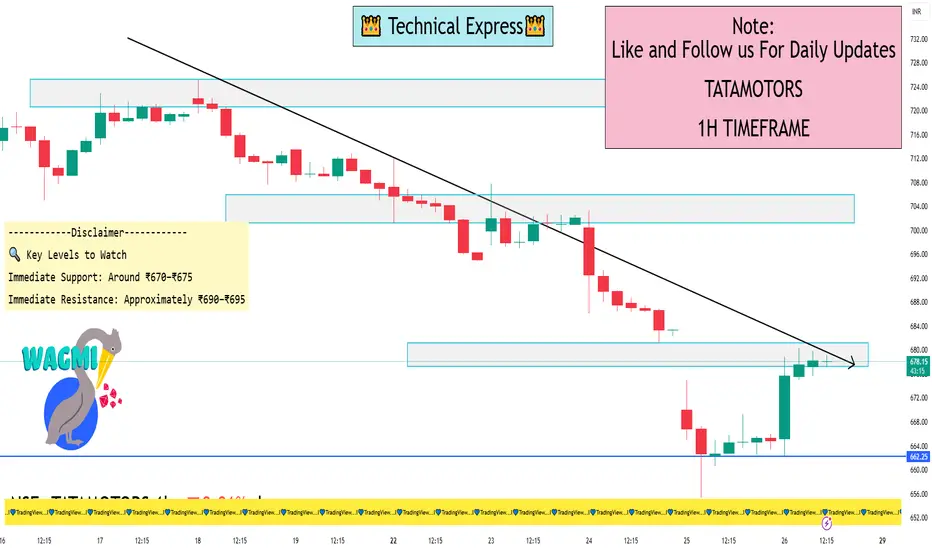
🔍 Key Levels to Watch
Immediate Support: Around ₹670–₹675. A breakdown below this level could lead to a retest of ₹650.
Immediate Resistance: Approximately ₹690–₹695. A breakout above this zone may target ₹720–₹730.
⚠️ Market Context
The recent uptick follows a challenging period marked by a cyberattack at Jaguar Land Rover, which had a significant financial impact. While operations are resuming, the stock remains sensitive to further developments.
Relative Strength Index (RSI): Approximately 50, suggesting balanced buying and selling pressures.
Moving Averages: The stock is trading near its short-term moving averages, with no clear bullish or bearish crossover.
Volume: Trading volume is consistent with recent averages, showing no significant spikes.
Given these indicators, the stock is consolidating within a range, awaiting a catalyst for a directional move.
🔍 Key Levels to Watch
Immediate Support: Around ₹670–₹675. A breakdown below this level could lead to a retest of ₹650.
Immediate Resistance: Approximately ₹690–₹695. A breakout above this zone may target ₹720–₹730.
⚠️ Market Context
The recent uptick follows a challenging period marked by a cyberattack at Jaguar Land Rover, which had a significant financial impact. While operations are resuming, the stock remains sensitive to further developments.
I built a Buy & Sell Signal Indicator with 85% accuracy.
📈 Get access via DM or
WhatsApp: wa.link/d997q0
Contact - +91 76782 40962
| Email: techncialexpress@gmail.com
| Script Coder | Trader | Investor | From India
📈 Get access via DM or
WhatsApp: wa.link/d997q0
Contact - +91 76782 40962
| Email: techncialexpress@gmail.com
| Script Coder | Trader | Investor | From India
관련 발행물
면책사항
해당 정보와 게시물은 금융, 투자, 트레이딩 또는 기타 유형의 조언이나 권장 사항으로 간주되지 않으며, 트레이딩뷰에서 제공하거나 보증하는 것이 아닙니다. 자세한 내용은 이용 약관을 참조하세요.