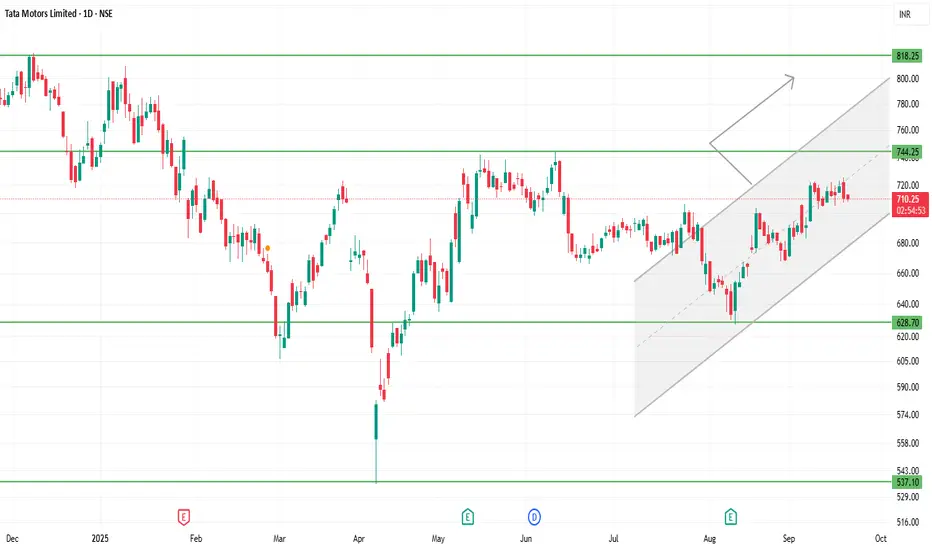
Tata Motors is trading around ₹710-₹720 (give or take).
The 52-week high is roughly ₹1,000+, and the 52-week low is approx ₹535-₹550.
There is visible investor concern: production halts (especially in JLR, its luxury arm) and demand pressures are weighing.
Recent performance is mixed; some short-term strength, but many indicators suggest resistance and caution.
⚙️ Technical / Trend Insights
The trend shows a mildly bullish bias in the short-term: price action is forming higher lows (e.g. holding above ₹700-705) which suggests buyers are defending downside.
Resistance zones are limiting gains: repeated attempts to push above ~₹720-725 have met selling.
Momentum indicators (RSI, MACD etc.) are positive but not deeply overbought — there’s room, but risk of pullbacks if resistance holds.
There are hints of bullish chart patterns (for example, ascending structures or potential reversal formations) if price manages to cross certain resistance levels.
⚠️ Risks / Things That Could Go Wrong
If it breaks down below ₹700-705, risk increases toward lower support in the ₹686-₹700 band.
Failure to break above ₹720-₹725 with decent volume could lead to sideways trading or minor corrections.
Macro / sectoral headwinds — demand issues, international business (JLR), cost pressures — could press down on fundamentals.
관련 발행물
면책사항
해당 정보와 게시물은 금융, 투자, 트레이딩 또는 기타 유형의 조언이나 권장 사항으로 간주되지 않으며, 트레이딩뷰에서 제공하거나 보증하는 것이 아닙니다. 자세한 내용은 이용 약관을 참조하세요.
관련 발행물
면책사항
해당 정보와 게시물은 금융, 투자, 트레이딩 또는 기타 유형의 조언이나 권장 사항으로 간주되지 않으며, 트레이딩뷰에서 제공하거나 보증하는 것이 아닙니다. 자세한 내용은 이용 약관을 참조하세요.