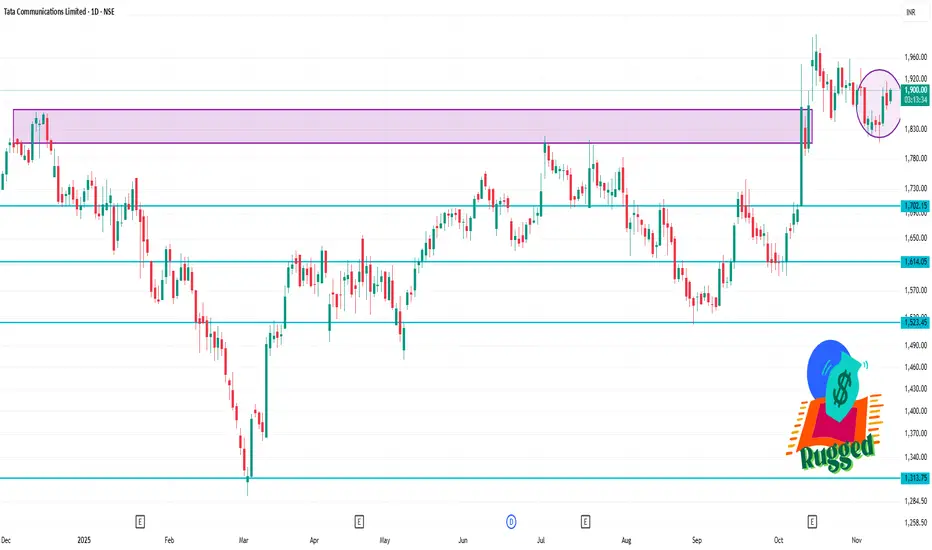
🎯 Key Levels
Current price (recent quote): ~ ₹1,876.
Pivot levels (daily classic):
Pivot ≈ ₹1,895.73
Support 1 (S1) ≈ ₹1,890.36
Resistance 1 (R1) ≈ ₹1,900.86
Additional support/resistance: S2 ≈ ₹1,885.23, R2 ≈ ₹1,906.23
Moving Average supports:
50-day SMA ≈ ₹1,858.81
100-day SMA ≈ ₹1,882.54
200-day SMA ≈ ₹1,846.83
✅ Trading Implications
If the stock manages to break and hold above the pivot (~₹1,895.7), then the next target is near ₹1,900–₹1,906 (R1/R2 area).
If it fails and drops below support levels (~₹1,890 and ~₹1,885), then watch for deeper support around the 50-day SMA (~₹1,858) or even ~₹1,846 (200-day SMA) in a more significant correction.
Given the bullish indicators, the preferred scenario is a break to the upside, but one must be aware of risk of reversal/weakness if momentum fades.
관련 발행물
면책사항
해당 정보와 게시물은 금융, 투자, 트레이딩 또는 기타 유형의 조언이나 권장 사항으로 간주되지 않으며, 트레이딩뷰에서 제공하거나 보증하는 것이 아닙니다. 자세한 내용은 이용 약관을 참조하세요.
관련 발행물
면책사항
해당 정보와 게시물은 금융, 투자, 트레이딩 또는 기타 유형의 조언이나 권장 사항으로 간주되지 않으며, 트레이딩뷰에서 제공하거나 보증하는 것이 아닙니다. 자세한 내용은 이용 약관을 참조하세요.