📌 Latest Price & 1‑Week Snapshot
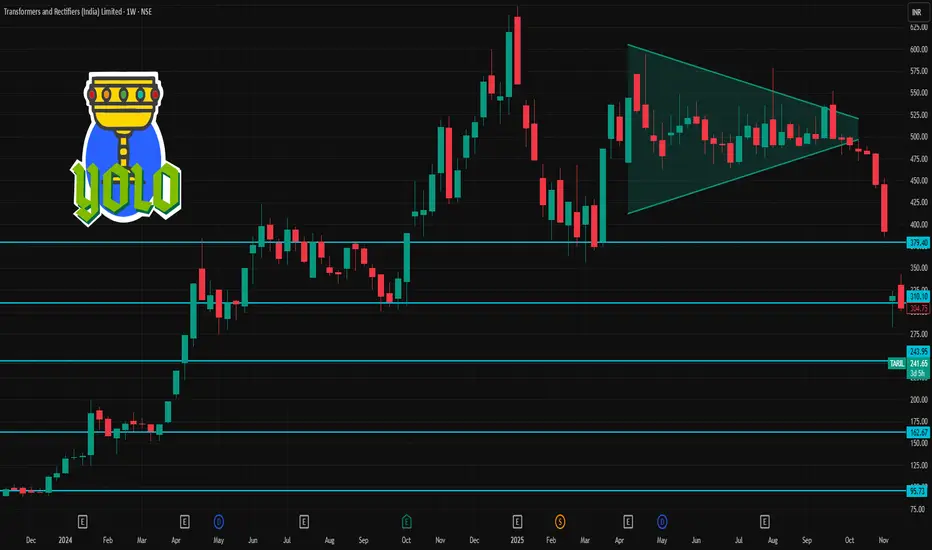
The stock is trading around ₹240–₹241 per share (NSE/BSE).
According to a recent summary, over the last 1 week the stock has moved approximately –7% to –7.4%.
52‑week range: Low ≈ ₹232–₹236, High ≈ ₹648–₹650.
Thus the stock is very near its 52‑week low — down roughly 63% from 52‑week high.
What this suggests (short‑term)
The share is currently at deep discount territory, close to 52‑week bottom — so for traders, this could mean limited downside (barring new negative news), but also that upside is large — albeit requiring major positive triggers.
Given weak near‑term momentum (recent dip, down ‑7% in a week), the stock may consolidate around current levels — ₹230–₹250 zone — unless there’s a strong catalyst.
🎯 What This Means for Short-Term Traders vs Long-Term Investors
Short-term traders: The ₹232–₹240 zone can be considered as a near-term support base. If the stock holds above ~₹235, a bounce is possible — but sharp volatility remains likely. Risk/reward is skewed toward a bounce — but with high uncertainty.
Medium/Long-term investors: The deep discount vs 52‑week high may look attractive — but fundamentals (earnings weakness, recent volatility, sanction overhang) suggest caution. The stock could recover substantially — if the company stabilizes business, wins new orders, and global/sector sentiment improves.
관련 발행물
면책사항
해당 정보와 게시물은 금융, 투자, 트레이딩 또는 기타 유형의 조언이나 권장 사항으로 간주되지 않으며, 트레이딩뷰에서 제공하거나 보증하는 것이 아닙니다. 자세한 내용은 이용 약관을 참조하세요.
관련 발행물
면책사항
해당 정보와 게시물은 금융, 투자, 트레이딩 또는 기타 유형의 조언이나 권장 사항으로 간주되지 않으며, 트레이딩뷰에서 제공하거나 보증하는 것이 아닙니다. 자세한 내용은 이용 약관을 참조하세요.