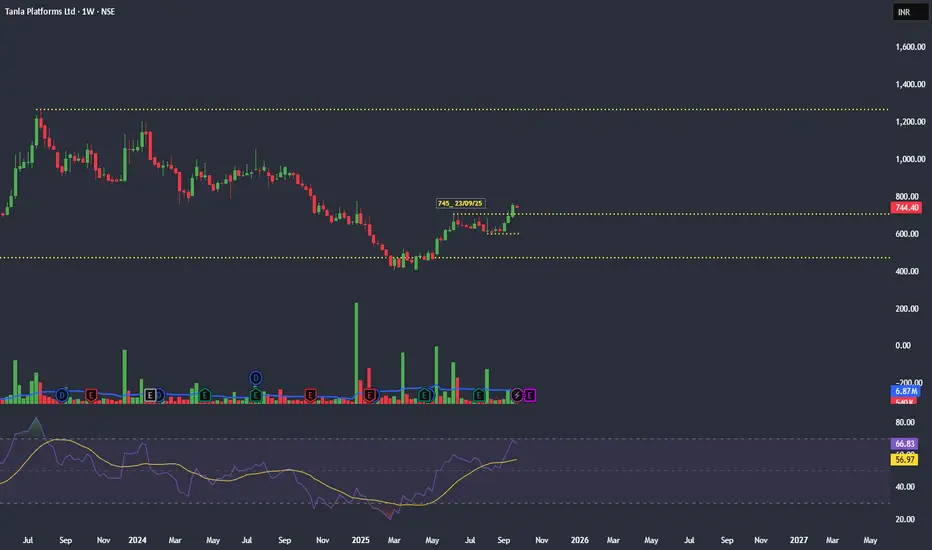
Price Action
CMP: ~₹685–690 (Sept 19, 2025)
Stock has been in a steady uptrend, consolidating above key support zones.
Trading well above 50 / 100 / 200 EMAs → strong structural trend.
Volume & Market Structure
Accumulation phase.
Price action forming a tight consolidation box between ₹670–₹700 → breakout likely if volumes expand further.
Sustained breakout above ₹700 with heavy volume can open room for a strong rally.
Indicators & Momentum
RSI (14): ~67.8 → bullish, nearing overbought but still healthy.
ADX: ~25.5 → moderate trend strength, room to expand further.
50 EMA (~₹645): Price trading above → confirms short-term strength.
100 EMA (~₹627): Price comfortably above → medium-term bullish.
200 EMA (~₹645): Price also above → long-term bullish alignment.
Key Levels
Resistance: ₹700 → ₹720 (near-term breakout zones)
Support: ₹670 → ₹650 → ₹627 (EMA cluster support)
Upside Targets
T1: ₹720
T2: ₹760
T3: ₹810 (extended swing target)
Invalidation
Close below ₹650 = short-term caution.
Close below ₹627 (100 EMA) = medium-term weakness.
Trading View Bias
Bias: Bullish above ₹670
Short-Term: ₹700 → ₹720
Medium-Term: ₹760 → ₹810
⚠️ Disclaimer: Educational analysis only, not financial advice. Do your own research before trading.
면책사항
해당 정보와 게시물은 금융, 투자, 트레이딩 또는 기타 유형의 조언이나 권장 사항으로 간주되지 않으며, 트레이딩뷰에서 제공하거나 보증하는 것이 아닙니다. 자세한 내용은 이용 약관을 참조하세요.
면책사항
해당 정보와 게시물은 금융, 투자, 트레이딩 또는 기타 유형의 조언이나 권장 사항으로 간주되지 않으며, 트레이딩뷰에서 제공하거나 보증하는 것이 아닙니다. 자세한 내용은 이용 약관을 참조하세요.