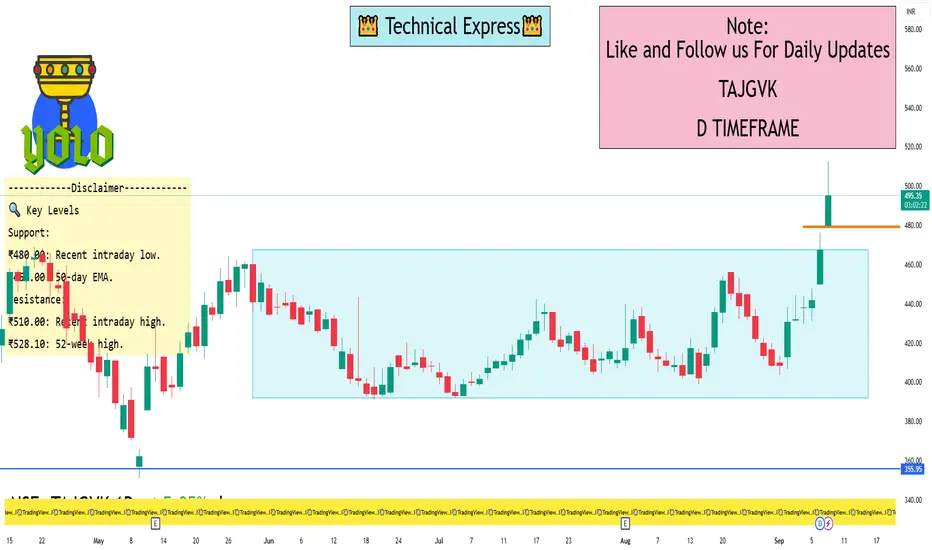
Previous close: ₹467.55
Current/last traded price: Approximately ₹498–499
Day’s price range:
Low: ₹480.00
High: ₹510.95
Percentage gain today: Around 6–7% — examples include +6.64%, +6.73%, +6.87%
Summary Table
Metric Value
Previous Close ₹467.55
Current Price ~₹498–499
Day’s Range ₹480.00 – ₹510.95
Intraday Gain ~6–7%
If you're interested in intraday charts, such as minute-by-minute candlestick data, or technical indicators like RSI or MACD, platforms like MarketWatch, TradingView, ChartInk, or Investing.com provide detailed one-day charts and tools
🧠 Market Sentiment
The stock has shown strong bullish momentum, breaking above key resistance levels. However, with the RSI in the overbought zone, traders should be cautious of potential short-term corrections.
I built a Buy & Sell Signal Indicator with 85% accuracy.
📈 Get access via DM or
WhatsApp: wa.link/d997q0
Contact - +91 76782 40962
| Email: techncialexpress@gmail.com
| Script Coder | Trader | Investor | From India
📈 Get access via DM or
WhatsApp: wa.link/d997q0
Contact - +91 76782 40962
| Email: techncialexpress@gmail.com
| Script Coder | Trader | Investor | From India
관련 발행물
면책사항
해당 정보와 게시물은 금융, 투자, 트레이딩 또는 기타 유형의 조언이나 권장 사항으로 간주되지 않으며, 트레이딩뷰에서 제공하거나 보증하는 것이 아닙니다. 자세한 내용은 이용 약관을 참조하세요.