SWSolar Sterling & Wilson cmp 335.10 by Daily Chart view
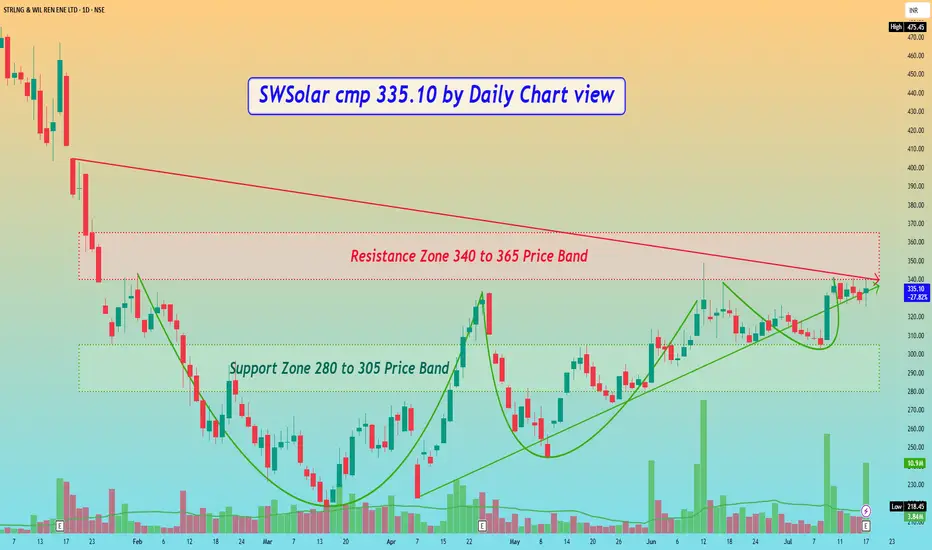
SWSolar cmp 335.10 by Daily Chart view
- Support Zone 280 to 305 Price Band
- Resistance Zone 340 to 365 Price Band
- Bullish VCP Pattern completed on stock chart
- Volumes spiking heavily at regular intervals by demand based buying
- Resistance Zone Neckline Breakout maybe seen unfolding in the near future
- Support Zone 280 to 305 Price Band
- Resistance Zone 340 to 365 Price Band
- Bullish VCP Pattern completed on stock chart
- Volumes spiking heavily at regular intervals by demand based buying
- Resistance Zone Neckline Breakout maybe seen unfolding in the near future
면책사항
해당 정보와 게시물은 금융, 투자, 트레이딩 또는 기타 유형의 조언이나 권장 사항으로 간주되지 않으며, 트레이딩뷰에서 제공하거나 보증하는 것이 아닙니다. 자세한 내용은 이용 약관을 참조하세요.
면책사항
해당 정보와 게시물은 금융, 투자, 트레이딩 또는 기타 유형의 조언이나 권장 사항으로 간주되지 않으며, 트레이딩뷰에서 제공하거나 보증하는 것이 아닙니다. 자세한 내용은 이용 약관을 참조하세요.