### **Technical Analysis of Swiggy Ltd. (NSE)**
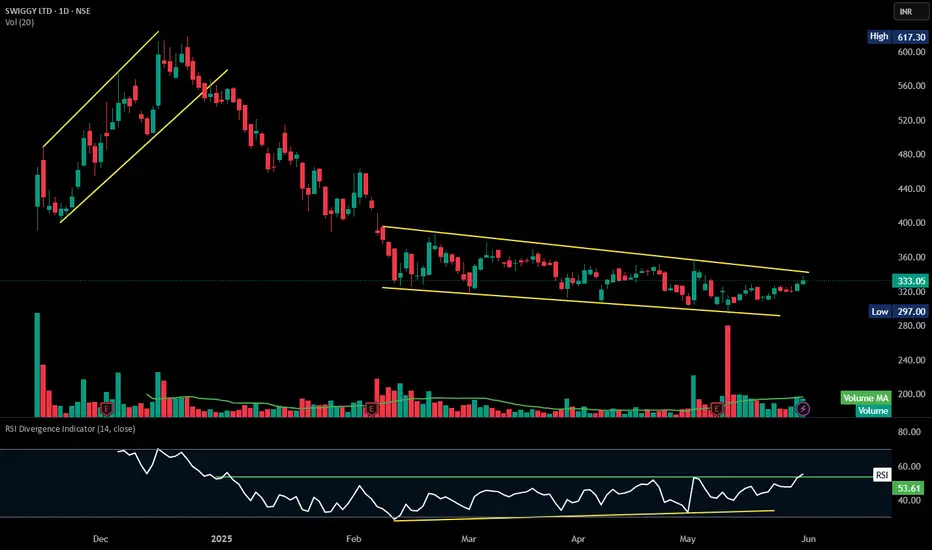
The chart highlights a **descending channel breakout**, indicating a potential trend reversal.
### **Key Observations:**
1. **Descending Channel Formation:**
- Price has oscillated within two downward-sloping trendlines from **January to June 2025**, creating a bearish trend.
- **Breakout above 333.05 INR** suggests buyers may be gaining control.
2. **Volume & Price Action:**
- **Current price:** **333.05 INR**, up **1.28% (+4.20 INR)**.
- **Volume (20-period moving average):** **19.7M vs. 21.35M**—watch for a sustained increase to confirm the breakout.
3. **RSI Divergence:**
- RSI is **55.23**, indicating improving momentum but not yet in overbought territory.
- Divergence suggests weakening bearish pressure, strengthening bullish reversal potential.
- **Support & Resistance:**
- **Support:** **297.00 INR**, the lower boundary of the previous range.
- **Resistance:** **352INR**, the prior high acting as an upside target.
면책사항
해당 정보와 게시물은 금융, 투자, 트레이딩 또는 기타 유형의 조언이나 권장 사항으로 간주되지 않으며, 트레이딩뷰에서 제공하거나 보증하는 것이 아닙니다. 자세한 내용은 이용 약관을 참조하세요.
면책사항
해당 정보와 게시물은 금융, 투자, 트레이딩 또는 기타 유형의 조언이나 권장 사항으로 간주되지 않으며, 트레이딩뷰에서 제공하거나 보증하는 것이 아닙니다. 자세한 내용은 이용 약관을 참조하세요.