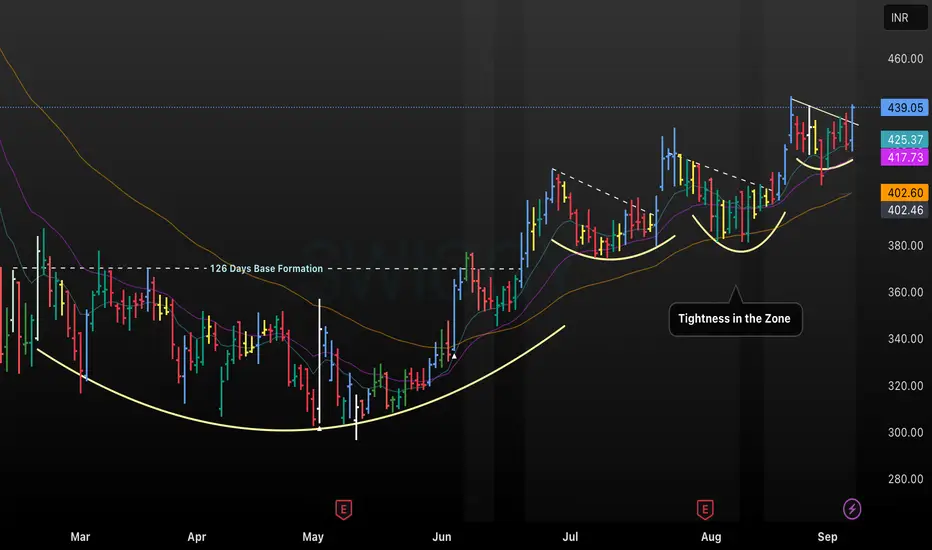
This chart analyzes SWIGGY’s recent price action and technical setup, featuring a 126-day base formation as a foundation for trend reversal and bullish momentum. The stock has shown consistent upward movement, supported by tightening in the zone and well-defined moving average support, with resistance levels around 439.05 INR. Tightness in the trend zone indicates buyer accumulation, increasing the probability of a sustained breakout following the consolidation phase and moving average alignment
면책사항
해당 정보와 게시물은 금융, 투자, 트레이딩 또는 기타 유형의 조언이나 권장 사항으로 간주되지 않으며, 트레이딩뷰에서 제공하거나 보증하는 것이 아닙니다. 자세한 내용은 이용 약관을 참조하세요.
면책사항
해당 정보와 게시물은 금융, 투자, 트레이딩 또는 기타 유형의 조언이나 권장 사항으로 간주되지 않으며, 트레이딩뷰에서 제공하거나 보증하는 것이 아닙니다. 자세한 내용은 이용 약관을 참조하세요.