On the weekly we are seeing some expansion of the bollinger mass in 3dwave pm heat map indicator. CCI is high, wave-pm is indicating very high levels of compression on all lengths
On the daily wave-pm is showing compression. 3D Wave-pm heat map is showing strength in these bollingers for support for price.
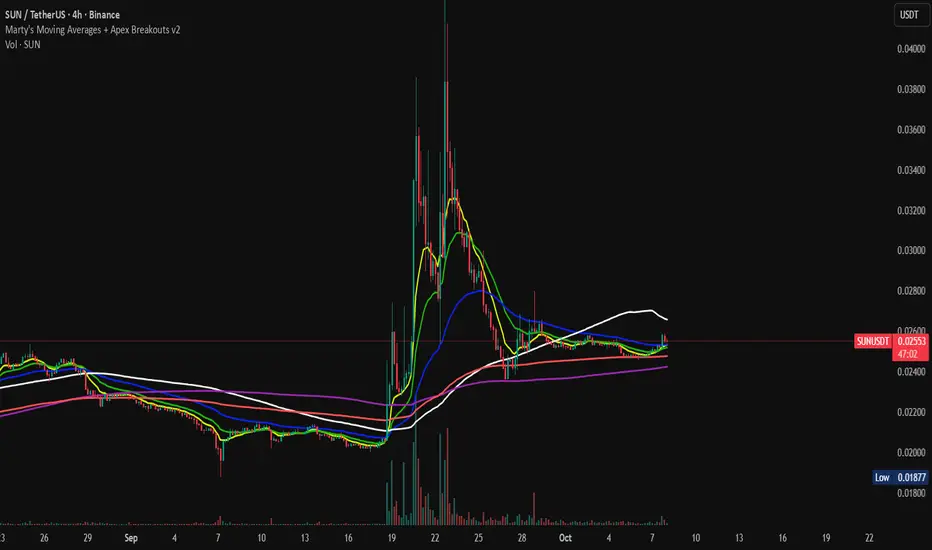
On the lower timeframe, 4hr we are seeing a range and massive compression on 3D Wave-PM indicated by all the blue. Within the green range we are seeing the micro beginnings of an expansion.
CryptoCheck Education / Buy & Sell Alerts
Trading Group 5 day FREE trial >>> discord.gg/jJG5EYA
More Info >>> thecryptocheck.com
Trading Group 5 day FREE trial >>> discord.gg/jJG5EYA
More Info >>> thecryptocheck.com
관련 발행물
면책사항
이 정보와 게시물은 TradingView에서 제공하거나 보증하는 금융, 투자, 거래 또는 기타 유형의 조언이나 권고 사항을 의미하거나 구성하지 않습니다. 자세한 내용은 이용 약관을 참고하세요.