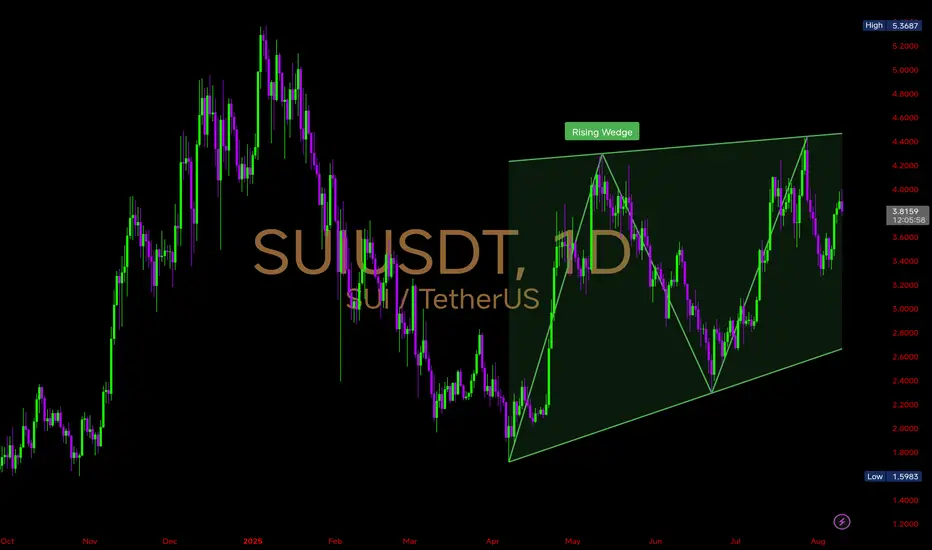
Price is currently trading inside a Rising Wedge pattern on the 1D timeframe — a structure that often signals potential trend exhaustion if broken to the downside, but can still extend higher within the channel before a breakout.
🔹Support: The lower wedge trendline has acted as a strong demand zone since April, with each test triggering a bounce.
🔸Resistance: The upper wedge trendline has repeatedly capped rallies near the $4.20–$4.40 zone.
🔹Current Price Action: #SUI Trading around $3.81, mid-range of the wedge, showing balanced buyer–seller pressure.
🔸Momentum: Higher lows are still intact, suggesting bullish structure until the lower wedge breaks.
POSSIBLE SCENARIOS
1️⃣ Bullish: Price pushes toward the $4.20–$4.40 resistance; a breakout above could target the $5+ zone.
2️⃣ Bearish: A breakdown below the lower wedge support (~$3.00) could trigger a deeper pullback toward $2.60–$2.40.
Watch for decisive daily candle closes near wedge boundaries — that will dictate the next major leg.
면책사항
이 정보와 게시물은 TradingView에서 제공하거나 보증하는 금융, 투자, 거래 또는 기타 유형의 조언이나 권고 사항을 의미하거나 구성하지 않습니다. 자세한 내용은 이용 약관을 참고하세요.
면책사항
이 정보와 게시물은 TradingView에서 제공하거나 보증하는 금융, 투자, 거래 또는 기타 유형의 조언이나 권고 사항을 의미하거나 구성하지 않습니다. 자세한 내용은 이용 약관을 참고하세요.