1D Technical Analysis for  SUI at Supply Zone $3.087
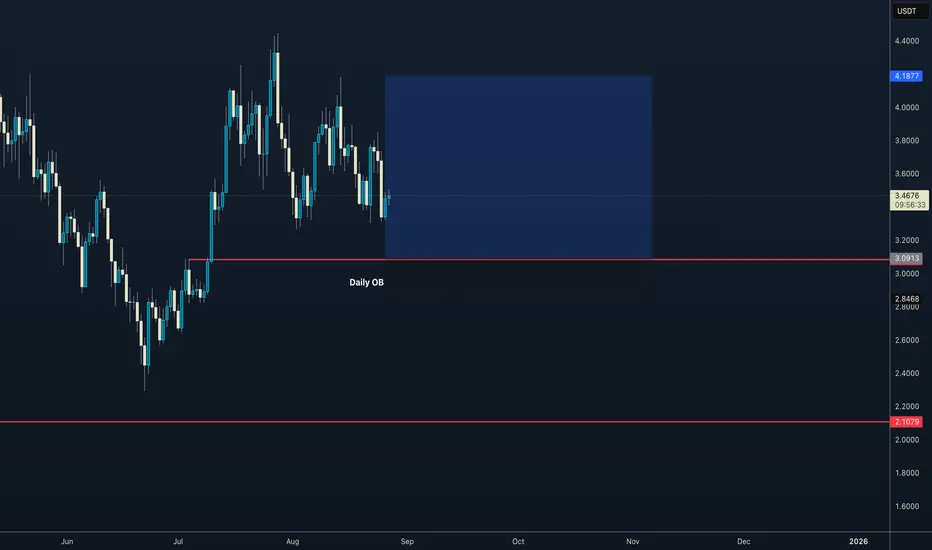
On the daily timeframe,SUI is currently trading slightly above the psychological and technical supply zone at $3.087. This level represents a significant area where sellers previously stepped in, creating overhead resistance that could cap upward momentum.
Price action in recent sessions showsSUI facing selling pressure near this zone, with multiple wick rejections on the daily candles hinting at potential resistance holding firm.
Volume around the supply zone maintains moderate levels, suggesting active battle between buyers and sellers but no overwhelming dominance.
The RSI at a near-neutral level (~52) on the daily suggests indecision and room for further moves either way without being overbought or oversold.
MACD and short-term EMAs display mixed signals: momentum is balanced but leaning slightly bullish if price can defend above this zone.
IfSUI can decisively break and hold above $3.087 supply, it would likely open path targets around $3.45–$4.00, with analyst resistance clusters noted near $3.67 and $4.00 in the medium term. Failure to hold above this supply zone risks a rejection down to strong support areas closer to $2.50–$2.70, which aligns with previous consolidation ranges and long-term demand.
On the daily timeframe,
Price action in recent sessions shows
Volume around the supply zone maintains moderate levels, suggesting active battle between buyers and sellers but no overwhelming dominance.
The RSI at a near-neutral level (~52) on the daily suggests indecision and room for further moves either way without being overbought or oversold.
MACD and short-term EMAs display mixed signals: momentum is balanced but leaning slightly bullish if price can defend above this zone.
If
면책사항
해당 정보와 게시물은 금융, 투자, 트레이딩 또는 기타 유형의 조언이나 권장 사항으로 간주되지 않으며, 트레이딩뷰에서 제공하거나 보증하는 것이 아닙니다. 자세한 내용은 이용 약관을 참조하세요.
면책사항
해당 정보와 게시물은 금융, 투자, 트레이딩 또는 기타 유형의 조언이나 권장 사항으로 간주되지 않으며, 트레이딩뷰에서 제공하거나 보증하는 것이 아닙니다. 자세한 내용은 이용 약관을 참조하세요.