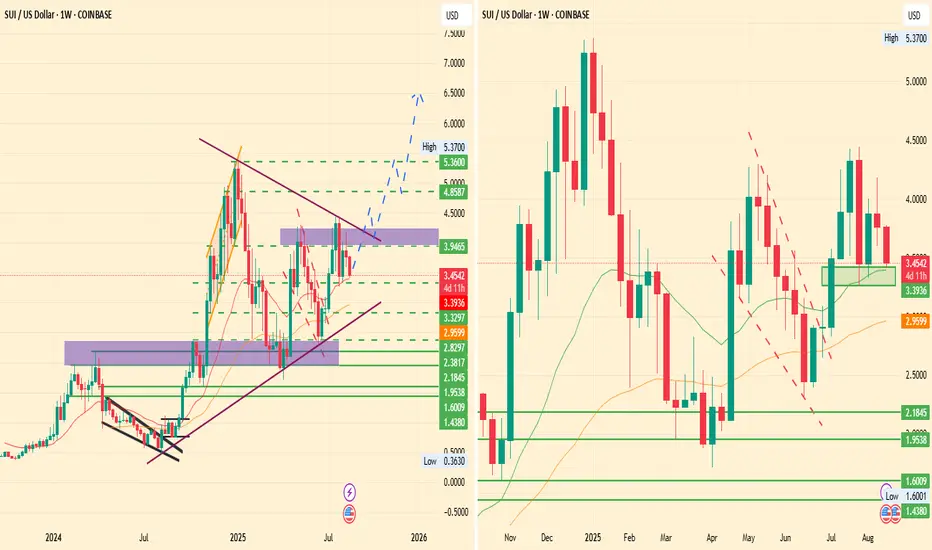
In the current quarter, July brought bullish demand, where this symmetrical pattern played its role on the weekly chart as the SUI price USD reflected a sharp rise from the lower border of this triangle to the upper edge, marking a 90% surge from $2.29 to $4.42.
Yet, August brought a pullback toward a key support level near $3.32. If this zone holds and bullish demand steps in, analysts anticipate a retest of the upper border of the pattern.
A successful breakout could send the SUI price forecast toward $5.37 in the coming weeks.
this retest in Q3 will be followed by an extended rally toward the $6.6 to $7.0 region in Q4 2025.
면책사항
이 정보와 게시물은 TradingView에서 제공하거나 보증하는 금융, 투자, 거래 또는 기타 유형의 조언이나 권고 사항을 의미하거나 구성하지 않습니다. 자세한 내용은 이용 약관을 참고하세요.
면책사항
이 정보와 게시물은 TradingView에서 제공하거나 보증하는 금융, 투자, 거래 또는 기타 유형의 조언이나 권고 사항을 의미하거나 구성하지 않습니다. 자세한 내용은 이용 약관을 참고하세요.