The stock is in clear uptrend on higher time frames (Weekly & Monthly).
It has given a break out on weekly time frame and now has come to retest the same level.
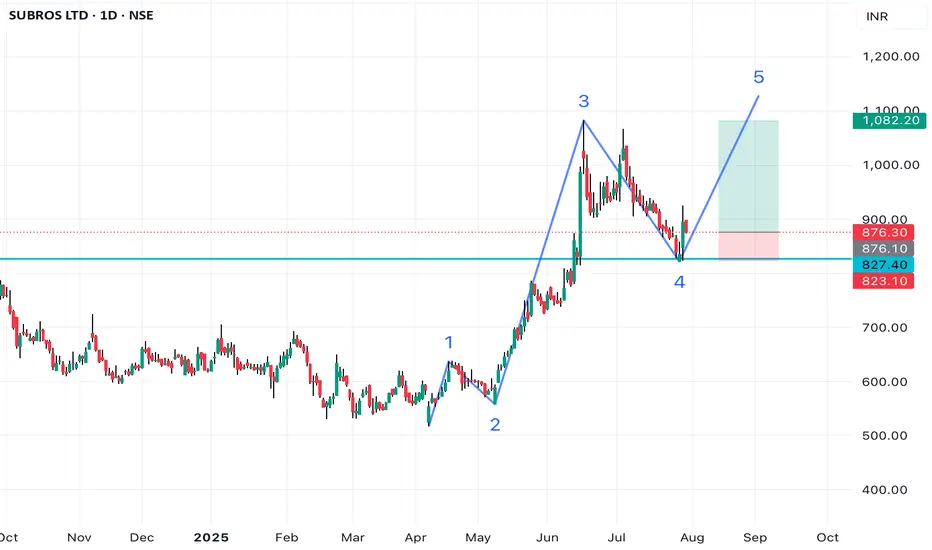
In daily TF we can see the bullish candle on support and a corrective wave (A-B-C).
It has also taken support on 50 EMA.
So the confluence of the 2 context gives some conviction on this chart. If NIFTY goes up then the chances of this stock going up increase dramatically.
NOTE: Pls do not take this as an advice, Just sharing my study.
It has given a break out on weekly time frame and now has come to retest the same level.
In daily TF we can see the bullish candle on support and a corrective wave (A-B-C).
It has also taken support on 50 EMA.
So the confluence of the 2 context gives some conviction on this chart. If NIFTY goes up then the chances of this stock going up increase dramatically.
NOTE: Pls do not take this as an advice, Just sharing my study.
면책사항
해당 정보와 게시물은 금융, 투자, 트레이딩 또는 기타 유형의 조언이나 권장 사항으로 간주되지 않으며, 트레이딩뷰에서 제공하거나 보증하는 것이 아닙니다. 자세한 내용은 이용 약관을 참조하세요.
면책사항
해당 정보와 게시물은 금융, 투자, 트레이딩 또는 기타 유형의 조언이나 권장 사항으로 간주되지 않으며, 트레이딩뷰에서 제공하거나 보증하는 것이 아닙니다. 자세한 내용은 이용 약관을 참조하세요.