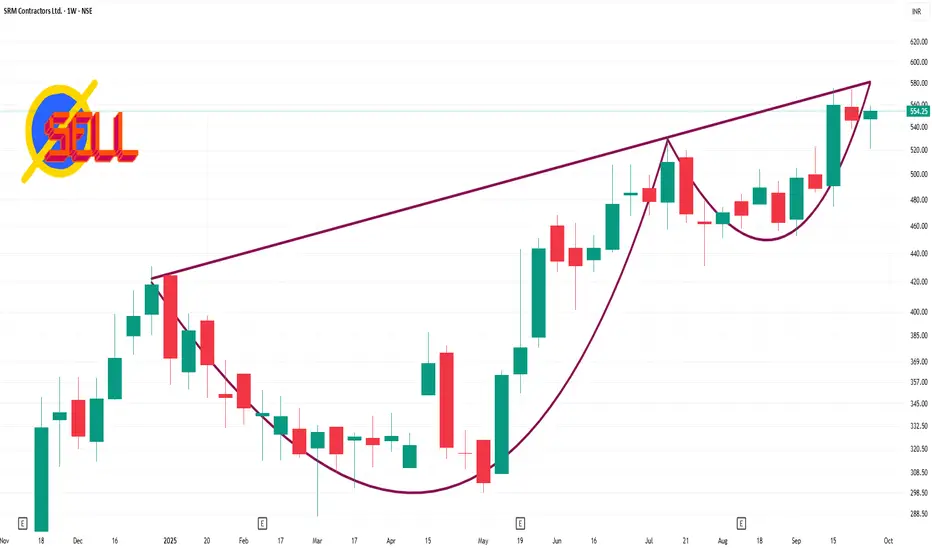
📈 1-Week Performance
Over the past week, the stock has appreciated by 1.51%
📊 Key Metrics
52-Week High: ₹575.20
52-Week Low: ₹246.00
Market Cap: Approximately ₹1,272 crore
P/E Ratio: 19.63
P/B Ratio: 4.5
The stock is currently trading above its 50-day and 200-day Simple Moving Averages, indicating a bullish trend.
🔍 Technical Outlook
The stock's current price above both the 50-day and 200-day SMAs indicates a bullish trend. The RSI suggests that the stock is in a neutral zone, neither overbought nor oversold, which could imply room for further upside. However, investors should monitor for any signs of overbought conditions or significant resistance levels near the 52-week high of ₹575.20.
관련 발행물
면책사항
해당 정보와 게시물은 금융, 투자, 트레이딩 또는 기타 유형의 조언이나 권장 사항으로 간주되지 않으며, 트레이딩뷰에서 제공하거나 보증하는 것이 아닙니다. 자세한 내용은 이용 약관을 참조하세요.
관련 발행물
면책사항
해당 정보와 게시물은 금융, 투자, 트레이딩 또는 기타 유형의 조언이나 권장 사항으로 간주되지 않으며, 트레이딩뷰에서 제공하거나 보증하는 것이 아닙니다. 자세한 내용은 이용 약관을 참조하세요.