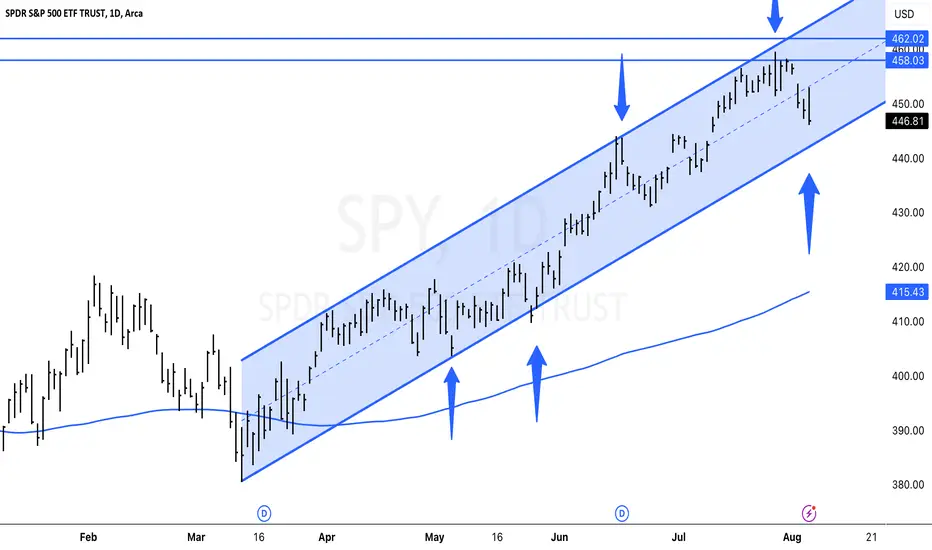
he  SPY is still in a parallel uptrend. The trend line has been in place since March 2023, and it has helped to support the stock market during periods of volatility. If the trend line breaks, the next support level will be at the 150-day moving average. This is a key level to watch, as a break below it could signal a more significant decline in the stock market.
However, it is important to remember that the stock market is cyclical, and it is normal for there to be periods of volatility. TheSPY has been in an uptrend for the past year, and it is possible that the trend line will continue to hold. If the trend line does break, it is important to stay calm and to not panic sell. Instead, you should wait for the stock market to find a bottom and then start buying again.
However, it is important to remember that the stock market is cyclical, and it is normal for there to be periods of volatility. The
면책사항
이 정보와 게시물은 TradingView에서 제공하거나 보증하는 금융, 투자, 거래 또는 기타 유형의 조언이나 권고 사항을 의미하거나 구성하지 않습니다. 자세한 내용은 이용 약관을 참고하세요.
면책사항
이 정보와 게시물은 TradingView에서 제공하거나 보증하는 금융, 투자, 거래 또는 기타 유형의 조언이나 권고 사항을 의미하거나 구성하지 않습니다. 자세한 내용은 이용 약관을 참고하세요.