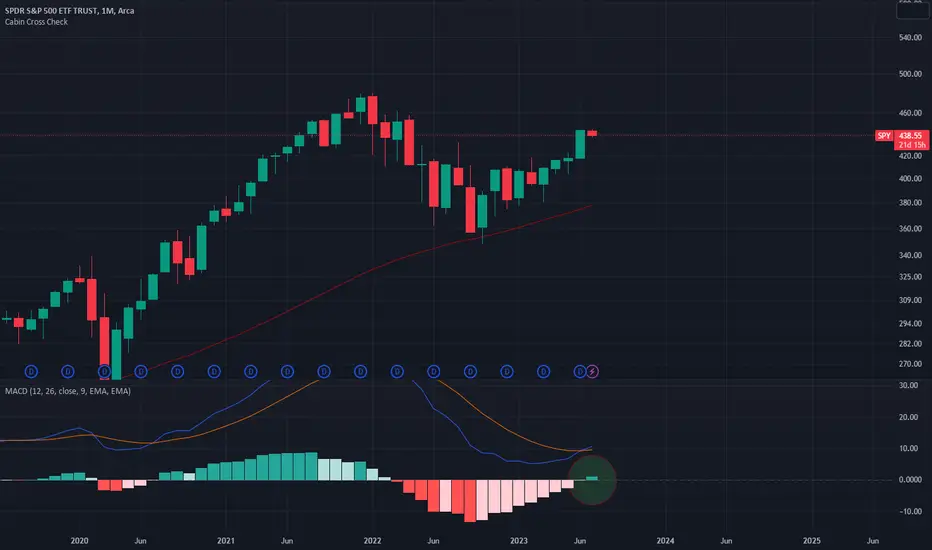
After nearly a 2 year-long absence, the monthly Moving Average Convergence Divergence (MACD) histogram has finally turned positive, signaling a potential shift in the market sentiment.
The appearance of the first green monthly MACD candle since August 2020 (following a massive selloff) for SPY in July 2023 is a notable technical development.
It suggests a potential shift in market sentiment and the possibility of a renewed or strengthened bullish trend. Market participants should closely monitor subsequent price action and additional indicators to confirm the sustainability of this momentum. As always, it is essential to exercise caution and conduct further analysis before making any investment decisions based on technical indicators alone.
The appearance of the first green monthly MACD candle since August 2020 (following a massive selloff) for
It suggests a potential shift in market sentiment and the possibility of a renewed or strengthened bullish trend. Market participants should closely monitor subsequent price action and additional indicators to confirm the sustainability of this momentum. As always, it is essential to exercise caution and conduct further analysis before making any investment decisions based on technical indicators alone.
면책사항
이 정보와 게시물은 TradingView에서 제공하거나 보증하는 금융, 투자, 거래 또는 기타 유형의 조언이나 권고 사항을 의미하거나 구성하지 않습니다. 자세한 내용은 이용 약관을 참고하세요.
면책사항
이 정보와 게시물은 TradingView에서 제공하거나 보증하는 금융, 투자, 거래 또는 기타 유형의 조언이나 권고 사항을 의미하거나 구성하지 않습니다. 자세한 내용은 이용 약관을 참고하세요.