Hello All,
Here are my thoughts on SPY's Trajectory based on where we stand now. For you technical cats out there, I have included some basic technical analysis to my traditionally quantitative approach.
Let's start with technicals and where we stand now.
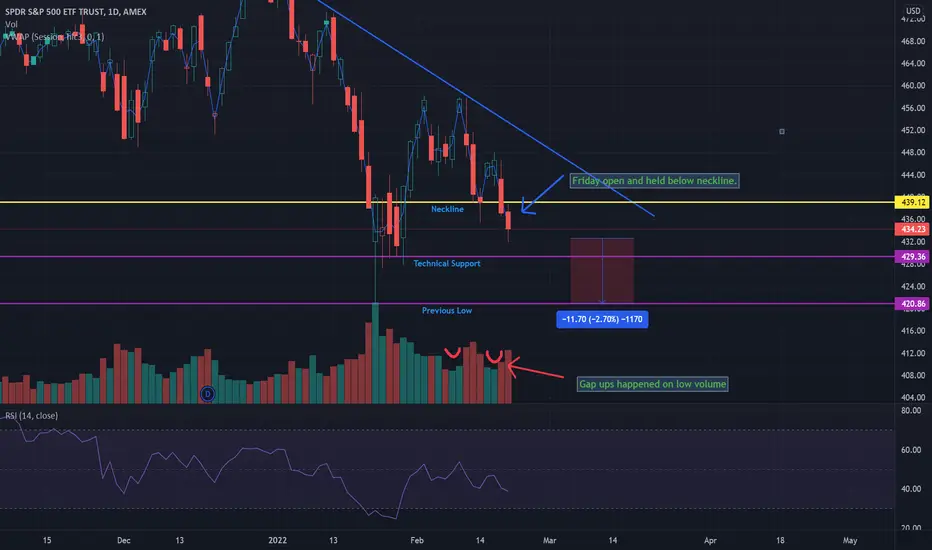
Thursday was a pivotal day. We saw a break away from that neckline consolidation and an open below the neckline on Friday. This is a strong bearish sign indicating the stock has gained the momentum and conviction for a bearish follow through from the double top.
We currently rest about 11 points away from re-testing previous lows. Over the past 10 days, SPY has been moving on average 7.2 points between its high and its low and we have strong technical support around 429. So its very unlikely we will re-test the lows in 1 day, but I suspect a continuation towards those lows, maybe a small bounce around open to stabilize RSI.
From a technical standpoint, I would be watching for a bounce up to the 439 area and, if I am short biased, looking for a rejection of this area for an entry short.
I wouldn't actually be surprised if we see a gap down on Tuesday morning. The market did a bounce at the end of day which was immediately rejected in afterhours trading back down to the lows. Regression tells me we could see an open as low as the 429 area. I kind of don't want this because this would cause a lot of panic and erratic behaviour at open from traders and investors panicking. But if this does happen, I would look for resistance around 432 and a bounce to the downside from here. If we pass 432, the next resistance would be our technical levels of 438.80 - 439 ish. Let's hope it doesn't happen, I would like a nice clean set up which an open below 432 will not really give us.
If you are long biased, I would look for a break of 439. There is a possibility we could retest 442. But this isn't as likely and there is a lot of mathmatical and technical resistance that the stock would have to fight through to attain.
And what does the quants data tell me?
At this point, we can expect to see the 420s in the coming days. The market has shown conviction to the downside. Regression forecast tells me we could see an ultimate low of around 428 on Tuesday, and this actually aligns nicely with the technical levels as well.
From a quantiative and technical standpoint, it all comes down to volume. Look at the chart. SPY gapped up with very low volume. When adjusting SPY data for the past 3 months, the relationship between volume and SPY selling off favors SPY's price decreasing as volume increases. This can be expressed in the following algebraic expression
R=0.224 of volume to the Downside and
R= 0.124 of volume to the Upside.
Where the closer R comes to 1 the more significant of a relationship exists.
Put another way, we can accurately express volume as a measure of how far the stock will deviate down from its open price. It can be expressed as
Volume = 5.031x x 10 ^ -8 from the open.
To express this algebraic equation in a worded ratio, substituting x for 25,000,000 of volume would yield the following:
For every 25,000,000 of volume SPY is traded at, SPY will fall approximately 1 point in value from its open.
As an example, if we take Friday for example, there was a volume of 132,454,300. If we want to test this alegbraic expression's accuracy, we simply take this number, divide by the volume to get the result.
So:
132,454,300 / 25,000,000 = 5.30
5.30 x 1 point = 5.30 points
The Actual deviation from the open on Friday was 5.51 (0.21 points off from the predicted).
Isn't math cool? :)
There is a cavet to this. While this expression is statistically and mathematically correct, seeing as we are observing a contextual phenomena (i.e stocks which are subjected to the same irrationality that drives human stupidity), we have to make an assumption. And that assumption is that SPY will continue its current downtrend.
While the statistics support this assumption, stocks are still vulnerable to human stupidity, as the market is predominately driven by people first and computers second.
Also, we must assume that this relationship is transitory. That is, it will not exist forever. Stocks are considered transitory from a mathematics standpoint, where a relationship will not exist for longer than it needs to. We have to watch for when the stock is going to reverse. I personally don't think its going to happen any time soon, but it is something to keep in mind. And from experience, it usually happens gradually to the point where I notice it before it causes too much damage. And this is why I update my mathmatic formulas weekly to include changes in market sentiment that has happened over the past week.
Anyway, these are my thoughts, hope you find them helpful!
As always, feel free to ask questions, leave comments, criticisms, etc.
Take care and enjoy the rest of this long weekend :).
Here are my thoughts on SPY's Trajectory based on where we stand now. For you technical cats out there, I have included some basic technical analysis to my traditionally quantitative approach.
Let's start with technicals and where we stand now.
Thursday was a pivotal day. We saw a break away from that neckline consolidation and an open below the neckline on Friday. This is a strong bearish sign indicating the stock has gained the momentum and conviction for a bearish follow through from the double top.
We currently rest about 11 points away from re-testing previous lows. Over the past 10 days, SPY has been moving on average 7.2 points between its high and its low and we have strong technical support around 429. So its very unlikely we will re-test the lows in 1 day, but I suspect a continuation towards those lows, maybe a small bounce around open to stabilize RSI.
From a technical standpoint, I would be watching for a bounce up to the 439 area and, if I am short biased, looking for a rejection of this area for an entry short.
I wouldn't actually be surprised if we see a gap down on Tuesday morning. The market did a bounce at the end of day which was immediately rejected in afterhours trading back down to the lows. Regression tells me we could see an open as low as the 429 area. I kind of don't want this because this would cause a lot of panic and erratic behaviour at open from traders and investors panicking. But if this does happen, I would look for resistance around 432 and a bounce to the downside from here. If we pass 432, the next resistance would be our technical levels of 438.80 - 439 ish. Let's hope it doesn't happen, I would like a nice clean set up which an open below 432 will not really give us.
If you are long biased, I would look for a break of 439. There is a possibility we could retest 442. But this isn't as likely and there is a lot of mathmatical and technical resistance that the stock would have to fight through to attain.
And what does the quants data tell me?
At this point, we can expect to see the 420s in the coming days. The market has shown conviction to the downside. Regression forecast tells me we could see an ultimate low of around 428 on Tuesday, and this actually aligns nicely with the technical levels as well.
From a quantiative and technical standpoint, it all comes down to volume. Look at the chart. SPY gapped up with very low volume. When adjusting SPY data for the past 3 months, the relationship between volume and SPY selling off favors SPY's price decreasing as volume increases. This can be expressed in the following algebraic expression
R=0.224 of volume to the Downside and
R= 0.124 of volume to the Upside.
Where the closer R comes to 1 the more significant of a relationship exists.
Put another way, we can accurately express volume as a measure of how far the stock will deviate down from its open price. It can be expressed as
Volume = 5.031x x 10 ^ -8 from the open.
To express this algebraic equation in a worded ratio, substituting x for 25,000,000 of volume would yield the following:
For every 25,000,000 of volume SPY is traded at, SPY will fall approximately 1 point in value from its open.
As an example, if we take Friday for example, there was a volume of 132,454,300. If we want to test this alegbraic expression's accuracy, we simply take this number, divide by the volume to get the result.
So:
132,454,300 / 25,000,000 = 5.30
5.30 x 1 point = 5.30 points
The Actual deviation from the open on Friday was 5.51 (0.21 points off from the predicted).
Isn't math cool? :)
There is a cavet to this. While this expression is statistically and mathematically correct, seeing as we are observing a contextual phenomena (i.e stocks which are subjected to the same irrationality that drives human stupidity), we have to make an assumption. And that assumption is that SPY will continue its current downtrend.
While the statistics support this assumption, stocks are still vulnerable to human stupidity, as the market is predominately driven by people first and computers second.
Also, we must assume that this relationship is transitory. That is, it will not exist forever. Stocks are considered transitory from a mathematics standpoint, where a relationship will not exist for longer than it needs to. We have to watch for when the stock is going to reverse. I personally don't think its going to happen any time soon, but it is something to keep in mind. And from experience, it usually happens gradually to the point where I notice it before it causes too much damage. And this is why I update my mathmatic formulas weekly to include changes in market sentiment that has happened over the past week.
Anyway, these are my thoughts, hope you find them helpful!
As always, feel free to ask questions, leave comments, criticisms, etc.
Take care and enjoy the rest of this long weekend :).
Get:
- Live Updates,
- Discord access,
- Access to my Proprietary Merlin Software,
- Access to premium indicators,
patreon.com/steversteves
Now on X!
- Live Updates,
- Discord access,
- Access to my Proprietary Merlin Software,
- Access to premium indicators,
patreon.com/steversteves
Now on X!
면책사항
이 정보와 게시물은 TradingView에서 제공하거나 보증하는 금융, 투자, 거래 또는 기타 유형의 조언이나 권고 사항을 의미하거나 구성하지 않습니다. 자세한 내용은 이용 약관을 참고하세요.