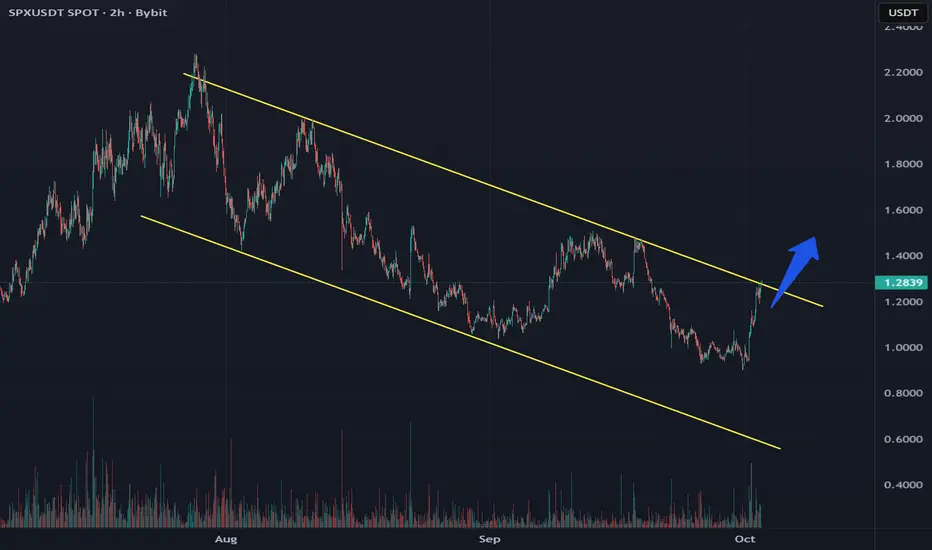
The SPX is moving within the boundaries of a bullish flag on the global timeframe
The price is attempting to break through the upper boundary of the pattern. If the price breaks through, the pattern predicts an upward price movement
Current price: $1.2429
If the price breaks through, the pattern predicts a price move to $1.3740 and above
Also, if the price fails to hold after breaking through the upper boundary, a downward rebound to 1.0118 and below is possible
More detailed analysis, additional charts, and key levels to watch are available on our site
면책사항
해당 정보와 게시물은 금융, 투자, 트레이딩 또는 기타 유형의 조언이나 권장 사항으로 간주되지 않으며, 트레이딩뷰에서 제공하거나 보증하는 것이 아닙니다. 자세한 내용은 이용 약관을 참조하세요.
면책사항
해당 정보와 게시물은 금융, 투자, 트레이딩 또는 기타 유형의 조언이나 권장 사항으로 간주되지 않으며, 트레이딩뷰에서 제공하거나 보증하는 것이 아닙니다. 자세한 내용은 이용 약관을 참조하세요.