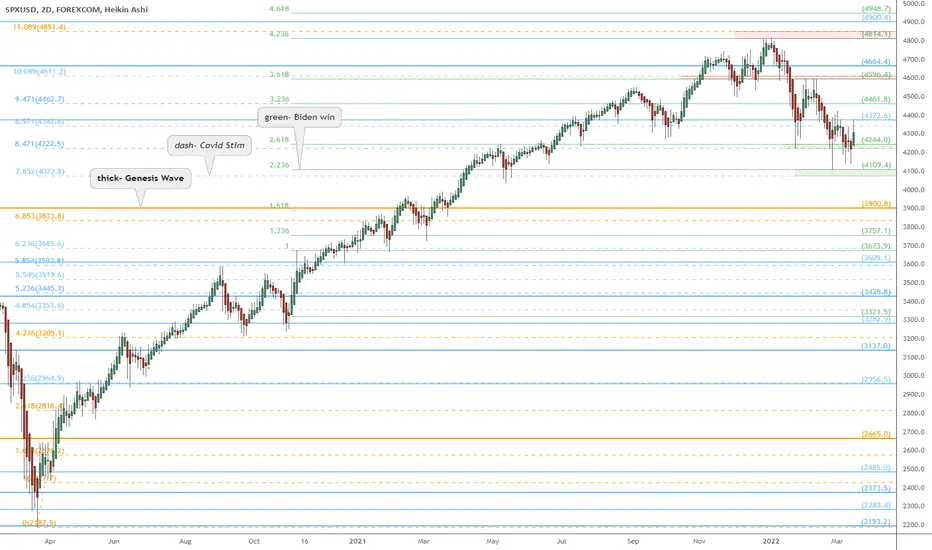
Plotted are 3 different sets of Fibonacci Extensions.
Each fib is like a "ruler" calibrated to a specific wave.
Every level is relevant, especially the confluence zones.
4372.6 is the key level to break and hold as bottom marker.
4343.6 is immediate support that strong bull would hold.
4222-4224 is key support for bulls to defend as a higher low.
4073-4019 should have been the bottom and NOT be retested.
For a closer look, check out this HOURLY view (click).
.
the Golden Ratio is my Religion
the Trading View is my Nation
the Moderator Tag is my Flag
the Trading View is my Nation
the Moderator Tag is my Flag
관련 발행물
면책사항
이 정보와 게시물은 TradingView에서 제공하거나 보증하는 금융, 투자, 거래 또는 기타 유형의 조언이나 권고 사항을 의미하거나 구성하지 않습니다. 자세한 내용은 이용 약관을 참고하세요.
the Golden Ratio is my Religion
the Trading View is my Nation
the Moderator Tag is my Flag
the Trading View is my Nation
the Moderator Tag is my Flag
관련 발행물
면책사항
이 정보와 게시물은 TradingView에서 제공하거나 보증하는 금융, 투자, 거래 또는 기타 유형의 조언이나 권고 사항을 의미하거나 구성하지 않습니다. 자세한 내용은 이용 약관을 참고하세요.