- SPXL has broken the ceiling of the falling trend in the medium long term, which indicates a slower initial falling rate.
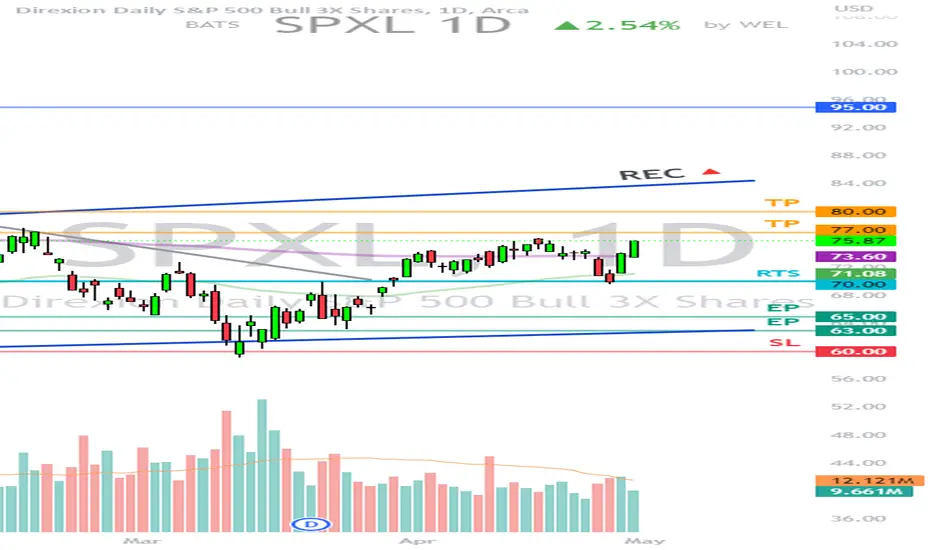
- SPXL is moving within a rectangle formation between support at 62.45 and resistance at 83.75.
- A decisive break through one of these levels indicates the new direction for the stock.
- The stock has marginally broken up through resistance at 75.00.
- Overall assessed as technically neutral for the medium long term.
*EP: Enter Price, SL: Support, TP: Take Profit, CL: Cut Loss, TF: Time Frame, RST: Resistance, RTS: Resistance to be Support LT TP: Long Term Target Price
*Chart Pattern:
DT - Double Top | BEARISH | RED
DB - Double Bottom | BULLISH | GREEN
HNS - Head & Shoulder | BEARISH | RED
REC - Rectangle | BLUE
iHNS - inverse head & Shoulder | BULLISH | GREEN
Verify it first and believe later.
The most profitable U.S. Stock VIP Signals Provider in Telegram Channel | Check our latest product updates: bit.ly/wavepoint-vip |
For more info:
Telegram: t.me/Wel_99
X: x.com/wavepoint99
For more info:
Telegram: t.me/Wel_99
X: x.com/wavepoint99
면책사항
이 정보와 게시물은 TradingView에서 제공하거나 보증하는 금융, 투자, 거래 또는 기타 유형의 조언이나 권고 사항을 의미하거나 구성하지 않습니다. 자세한 내용은 이용 약관을 참고하세요.