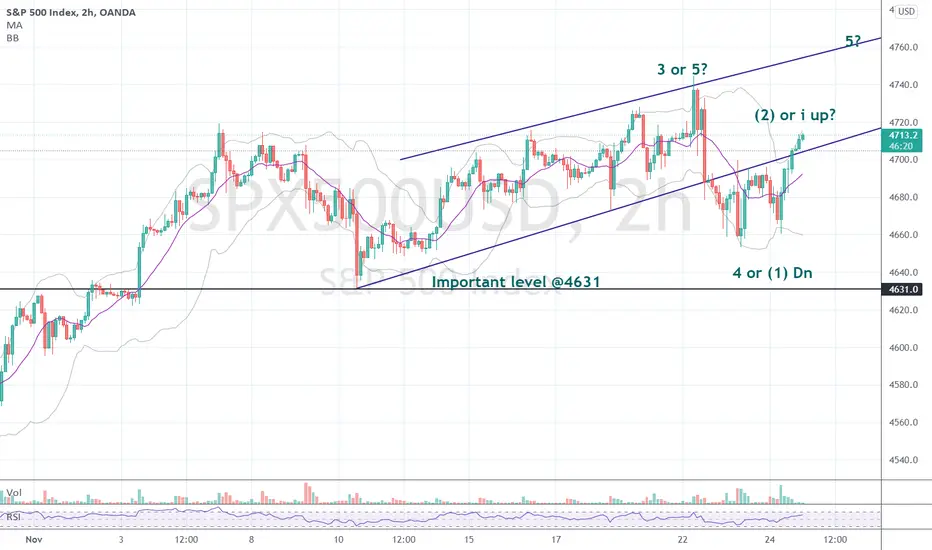
Long held trends tend to hold-up, well... long. I've labeled the chart with 2 of what I think are the most plausible EW count scenarios. It does allow to see where the risk and acceleration levels likely are. Only time will tell if the top is in, or if we are going still higher yet.
액티브 트레이드
At time of writing the SPX500 has dropped substantially. So the bear market count comes into play. Have said that the current shape of the downturn could also be interpreted as an ABC and the correction could end soon. The next few trading days will clear up the picture.면책사항
이 정보와 게시물은 TradingView에서 제공하거나 보증하는 금융, 투자, 거래 또는 기타 유형의 조언이나 권고 사항을 의미하거나 구성하지 않습니다. 자세한 내용은 이용 약관을 참고하세요.
면책사항
이 정보와 게시물은 TradingView에서 제공하거나 보증하는 금융, 투자, 거래 또는 기타 유형의 조언이나 권고 사항을 의미하거나 구성하지 않습니다. 자세한 내용은 이용 약관을 참고하세요.
