are always important later. click the "add more candles" blue arrow
노트
if it populates after publishing and provides one노트
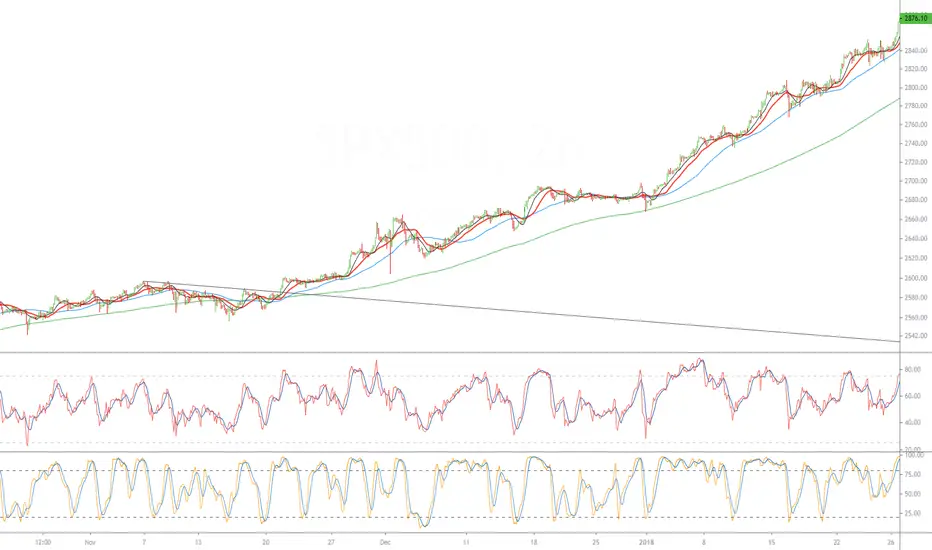
it didnt give me the blue arrow, but you can click and drag the chart to the left to show future candles and see the result. the point is to watch for these kinds of break outs (you can see how important that break out was by how far it went) and keep the line on your chart or be able to pick out the break out later and draw it in.노트
and if you think that is crazy, extend the same line to christmas 2018.면책사항
해당 정보와 게시물은 금융, 투자, 트레이딩 또는 기타 유형의 조언이나 권장 사항으로 간주되지 않으며, 트레이딩뷰에서 제공하거나 보증하는 것이 아닙니다. 자세한 내용은 이용 약관을 참조하세요.
면책사항
해당 정보와 게시물은 금융, 투자, 트레이딩 또는 기타 유형의 조언이나 권장 사항으로 간주되지 않으며, 트레이딩뷰에서 제공하거나 보증하는 것이 아닙니다. 자세한 내용은 이용 약관을 참조하세요.