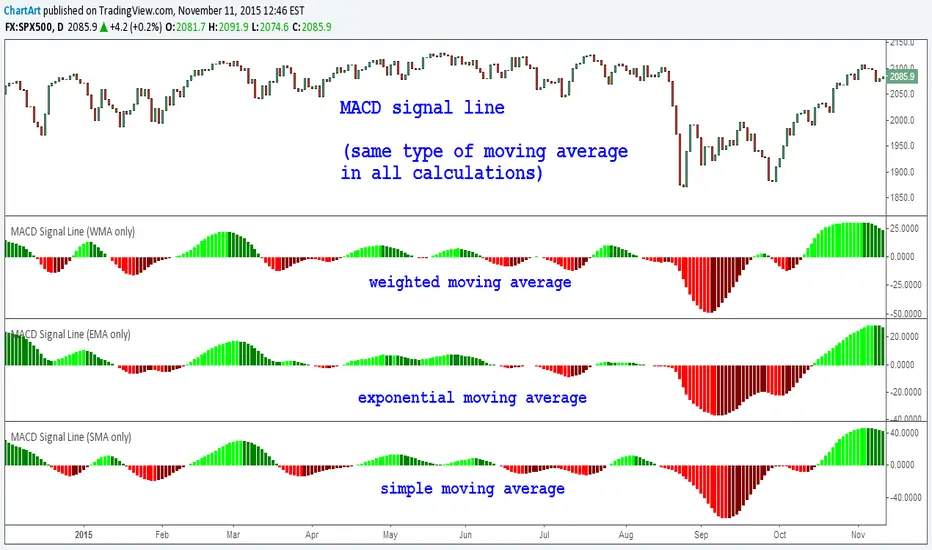
This is my research into the behavior of different moving average calculations to different aspects of the MACD. The MACD consists of three parts:
This is part three of my research which only shows the signal line of the purely WMA / EMA / SMA based MACD.
Here is part one, the histogram of the MACD:
![[STUDY] MACD. Part 1: Histogram (Comparison of moving averages)](https://s3.tradingview.com/e/eRSEmsKW_mid.png)
And here you can find part two, the original MACD itself:
![[STUDY] MACD. Part 2: MACD (Comparison of moving averages)](https://s3.tradingview.com/d/DGqbSSAk_mid.png)
- 1. The MACD (moving average convergence/divergence of the fast moving average period 12 versus the slower moving average period 26)
- 2. The signal line (moving average period 9) of the MACD
- 3. The histogram of the MACD (difference between MACD and the signal line)
This is part three of my research which only shows the signal line of the purely WMA / EMA / SMA based MACD.
Here is part one, the histogram of the MACD:
And here you can find part two, the original MACD itself:
관련 발행물
면책사항
이 정보와 게시물은 TradingView에서 제공하거나 보증하는 금융, 투자, 거래 또는 기타 유형의 조언이나 권고 사항을 의미하거나 구성하지 않습니다. 자세한 내용은 이용 약관을 참고하세요.
관련 발행물
면책사항
이 정보와 게시물은 TradingView에서 제공하거나 보증하는 금융, 투자, 거래 또는 기타 유형의 조언이나 권고 사항을 의미하거나 구성하지 않습니다. 자세한 내용은 이용 약관을 참고하세요.