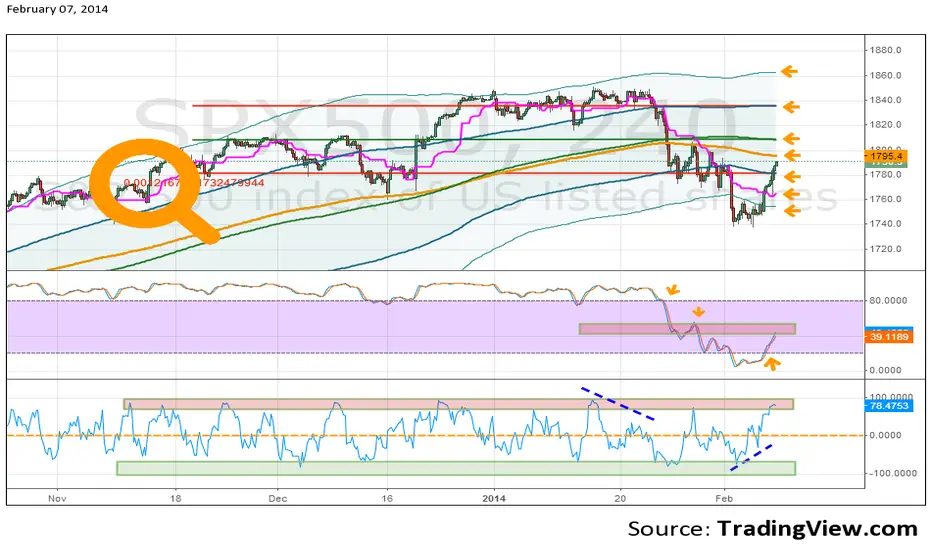
Plot LInear Regression as much as possible horizontal, close to 0.000
With the number YOU get plot EMA, BB with 1&2 deviation and Stoch.
For clues plot Ichimoku standard line and for divergence CMO or other indicators You like - settings according to your trading plan.
YOU can use this system on all timeframes - on lower timeframes You must change settings more often to plot horizontal LINREG... (use also different deviations of LINREG...
just WATCH, DECIDE, INNoVATE and make $$$ - GLT.
면책사항
이 정보와 게시물은 TradingView에서 제공하거나 보증하는 금융, 투자, 거래 또는 기타 유형의 조언이나 권고 사항을 의미하거나 구성하지 않습니다. 자세한 내용은 이용 약관을 참고하세요.
면책사항
이 정보와 게시물은 TradingView에서 제공하거나 보증하는 금융, 투자, 거래 또는 기타 유형의 조언이나 권고 사항을 의미하거나 구성하지 않습니다. 자세한 내용은 이용 약관을 참고하세요.