📊 Key insight
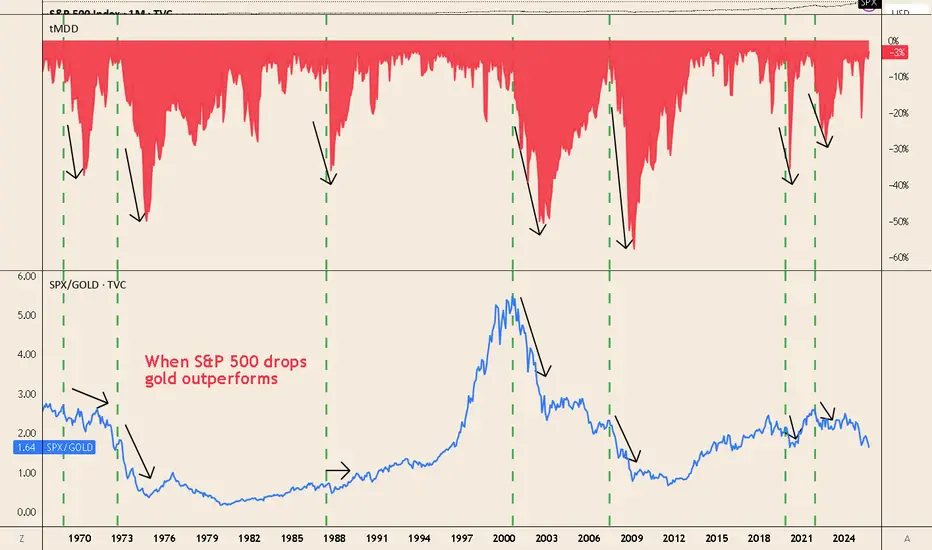
-Every major equity drawdown coincides with a drop in the SPX/Gold ratio — meaning gold outperforms stocks.
📉 What the chart shows
-1973–74 (stagflation): deep S&P 500 drawdown, SPX/Gold collapses.
-2000–02 (tech bust): ratio peaks ~5, then trends lower as gold rises and equities fall.
-2008–11 (GFC): brief liquidity hit to gold, then SPX/Gold plunges as gold rallies.
-2020 (COVID shock): rapid drop in SPX/Gold during equity sell-off.
-2022 bear market: ratio turns down again with inflation and rate stress.
Why it happens
-During market stress, investors seek safe collateral → gold demand spikes.
-Real rates and recession fears hurt equities more than gold.
-Silver carries industrial exposure, gold acts as a true safe haven.
🛡️ How to use it
-A gold allocation helps hedge against equity drawdowns.
-Long GOLD / short
  SPX (ratio trade) historically reduces portfolio volatility.
-Note: gold can dip during initial liquidity shocks (e.g., 2008, Mar 2020) — but recovers faster than equities.
-Every major equity drawdown coincides with a drop in the SPX/Gold ratio — meaning gold outperforms stocks.
📉 What the chart shows
-1973–74 (stagflation): deep S&P 500 drawdown, SPX/Gold collapses.
-2000–02 (tech bust): ratio peaks ~5, then trends lower as gold rises and equities fall.
-2008–11 (GFC): brief liquidity hit to gold, then SPX/Gold plunges as gold rallies.
-2020 (COVID shock): rapid drop in SPX/Gold during equity sell-off.
-2022 bear market: ratio turns down again with inflation and rate stress.
Why it happens
-During market stress, investors seek safe collateral → gold demand spikes.
-Real rates and recession fears hurt equities more than gold.
-Silver carries industrial exposure, gold acts as a true safe haven.
🛡️ How to use it
-A gold allocation helps hedge against equity drawdowns.
-Long
-Note: gold can dip during initial liquidity shocks (e.g., 2008, Mar 2020) — but recovers faster than equities.
면책사항
해당 정보와 게시물은 금융, 투자, 트레이딩 또는 기타 유형의 조언이나 권장 사항으로 간주되지 않으며, 트레이딩뷰에서 제공하거나 보증하는 것이 아닙니다. 자세한 내용은 이용 약관을 참조하세요.
면책사항
해당 정보와 게시물은 금융, 투자, 트레이딩 또는 기타 유형의 조언이나 권장 사항으로 간주되지 않으며, 트레이딩뷰에서 제공하거나 보증하는 것이 아닙니다. 자세한 내용은 이용 약관을 참조하세요.