Technical Analysis and Outlook:
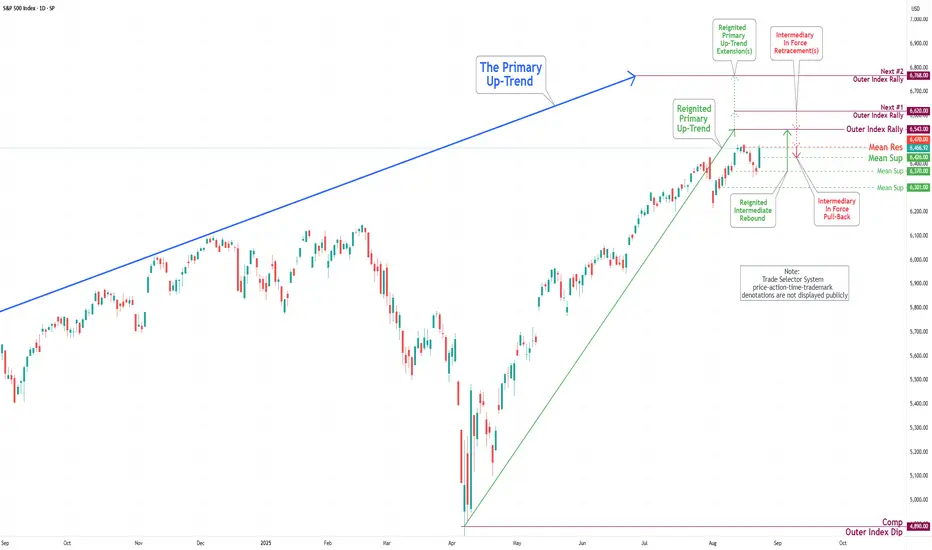
During the trading activity of the previous week, the S&P 500 Index experienced significant volatility before reestablishing its strong bullish trend. Initially, the Index faced a substantial decline, reaching our designated target of Mean Support at 6370. Subsequently, it rebounded vigorously, attaining our target of Mean Resistance at 6470, and is currently aiming for the Outer Index Rally target of 6543. It is essential to recognize, however, that there remains a possibility of a decline to Mean Support at 6426 before the upward trajectory resumes.
During the trading activity of the previous week, the S&P 500 Index experienced significant volatility before reestablishing its strong bullish trend. Initially, the Index faced a substantial decline, reaching our designated target of Mean Support at 6370. Subsequently, it rebounded vigorously, attaining our target of Mean Resistance at 6470, and is currently aiming for the Outer Index Rally target of 6543. It is essential to recognize, however, that there remains a possibility of a decline to Mean Support at 6426 before the upward trajectory resumes.
관련 발행물
면책사항
이 정보와 게시물은 TradingView에서 제공하거나 보증하는 금융, 투자, 거래 또는 기타 유형의 조언이나 권고 사항을 의미하거나 구성하지 않습니다. 자세한 내용은 이용 약관을 참고하세요.
면책사항
이 정보와 게시물은 TradingView에서 제공하거나 보증하는 금융, 투자, 거래 또는 기타 유형의 조언이나 권고 사항을 의미하거나 구성하지 않습니다. 자세한 내용은 이용 약관을 참고하세요.