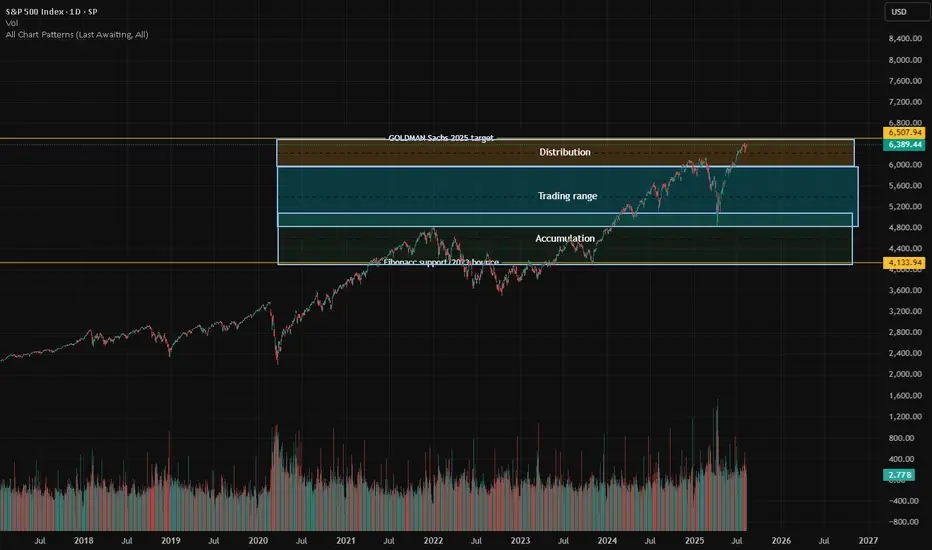
Fibonacci-Based Zones: The chart is structured around support and resistance zones derived from Fibonacci analysis, providing natural levels for market reaction.
Accumulation Zone: Lower price area (~4,133.94 and above) where buyers show interest and trend reversal is often seeded.
Trading Range: The broad mid-section where price is expected to oscillate, indicating indecision or equilibrium among buyers and sellers.
Distribution Zone: Upper price band near the Goldman Sachs 2025 target, as marked, where profit-taking and seller interest increases.
Potential for Parabolic Move: If price decisively breaks out above the distribution/resistance zone, it could trigger rapid, euphoric buying—a classic market melt-up.
Risk of Downside: Falling below the key Fibonacci support level could prompt a sharp correction,.
Historical Validation: Past price movements respect these zones.
면책사항
해당 정보와 게시물은 금융, 투자, 트레이딩 또는 기타 유형의 조언이나 권장 사항으로 간주되지 않으며, 트레이딩뷰에서 제공하거나 보증하는 것이 아닙니다. 자세한 내용은 이용 약관을 참조하세요.
면책사항
해당 정보와 게시물은 금융, 투자, 트레이딩 또는 기타 유형의 조언이나 권장 사항으로 간주되지 않으며, 트레이딩뷰에서 제공하거나 보증하는 것이 아닙니다. 자세한 내용은 이용 약관을 참조하세요.