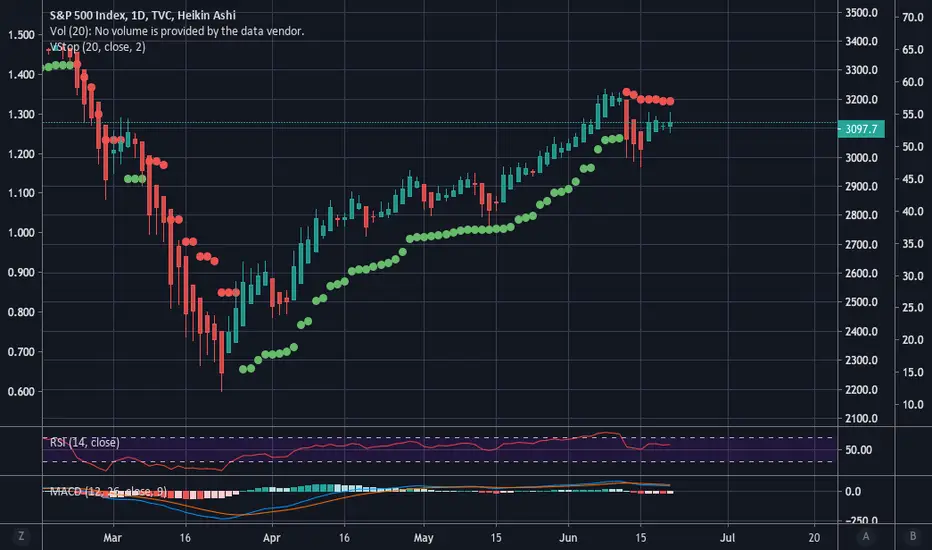
The daily chart using Heikin Ashi candles with volatility stops indicates that the trend changed to a downtrend last Thursday. A reasonable move back up would stop out these trending chart indicators, but they can be useful for longer-term trades. For instance, as you can see in the chart, had you traded off of these alone, you would have gone long on March 25th until last Thursday.
면책사항
이 정보와 게시물은 TradingView에서 제공하거나 보증하는 금융, 투자, 거래 또는 기타 유형의 조언이나 권고 사항을 의미하거나 구성하지 않습니다. 자세한 내용은 이용 약관을 참고하세요.
면책사항
이 정보와 게시물은 TradingView에서 제공하거나 보증하는 금융, 투자, 거래 또는 기타 유형의 조언이나 권고 사항을 의미하거나 구성하지 않습니다. 자세한 내용은 이용 약관을 참고하세요.