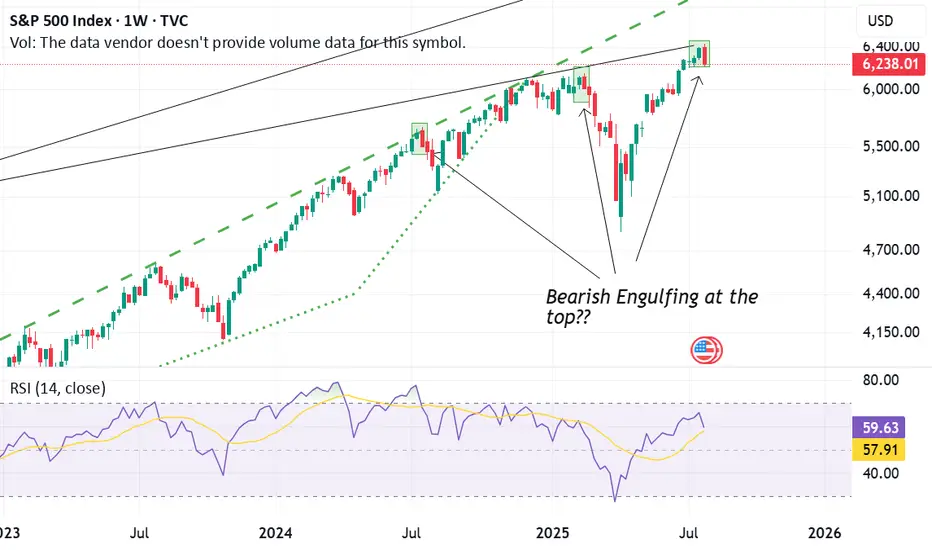
Last week, the S&P 500 Index (SPX) printed a bearish engulfing candle on the weekly chart. This candlestick pattern occurs when a larger red (bearish) candle completely "engulfs" the body of the previous green (bullish) candle. It is a classic reversal signal, often indicating that the momentum may be shifting from bullish to bearish.
What makes this significant is the recurring pattern we've observed:
At each of the last three market tops, the SPX formed a bearish engulfing pattern—and each time, this was followed by a notable correction or pullback.
The current candle mirrors those past setups almost identically, suggesting that the market may again be vulnerable to a short-term decline.
However, the big question remains:
"Will this time be different?"
In short, the bearish engulfing pattern is a warning sign—especially given its historical reliability at tops—but confirmation is key.
Ask ChatGPT
노트
Confirmation did not come next week that negates the downside view...Apologies for the late update면책사항
해당 정보와 게시물은 금융, 투자, 트레이딩 또는 기타 유형의 조언이나 권장 사항으로 간주되지 않으며, 트레이딩뷰에서 제공하거나 보증하는 것이 아닙니다. 자세한 내용은 이용 약관을 참조하세요.
면책사항
해당 정보와 게시물은 금융, 투자, 트레이딩 또는 기타 유형의 조언이나 권장 사항으로 간주되지 않으며, 트레이딩뷰에서 제공하거나 보증하는 것이 아닙니다. 자세한 내용은 이용 약관을 참조하세요.