Description:
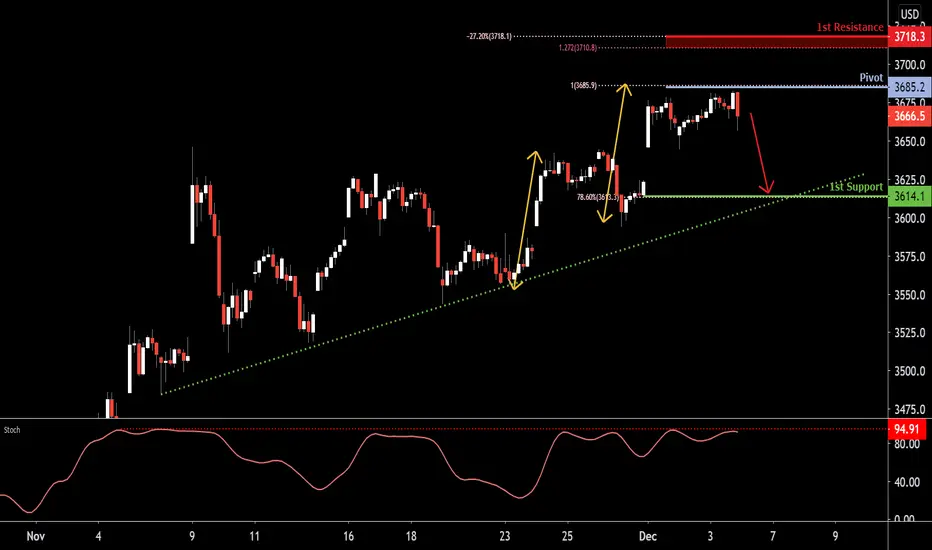
Price reacting and pulling back from recent swing high and Pivot at 3685.2. With RSI testing resistance where price reacted in the past, we see a low probability bearish scenario where price may drop towards ascending trendline support and 1st support at 3614.1. Otherwise, failure to hold below pivot should see price swing the other way towards Fibonacci confluence zone and 1st resistance at 3718.3
Pivot: 3685.2
Supporting Points:
100% Fibonacci extension, Graphical swing high resistance
1st Support: 3614.1
Supporting Points:
78.6% Fibonacci retracement, Ascending trendline support
1st Resistance: 3718.3
Supporting Points:
-27.2% Fibonacci retracement, 127.2% Fibonacci extension
Trading FX & CFDs carries high risk.
면책사항
이 정보와 게시물은 TradingView에서 제공하거나 보증하는 금융, 투자, 거래 또는 기타 유형의 조언이나 권고 사항을 의미하거나 구성하지 않습니다. 자세한 내용은 이용 약관을 참고하세요.
면책사항
이 정보와 게시물은 TradingView에서 제공하거나 보증하는 금융, 투자, 거래 또는 기타 유형의 조언이나 권고 사항을 의미하거나 구성하지 않습니다. 자세한 내용은 이용 약관을 참고하세요.