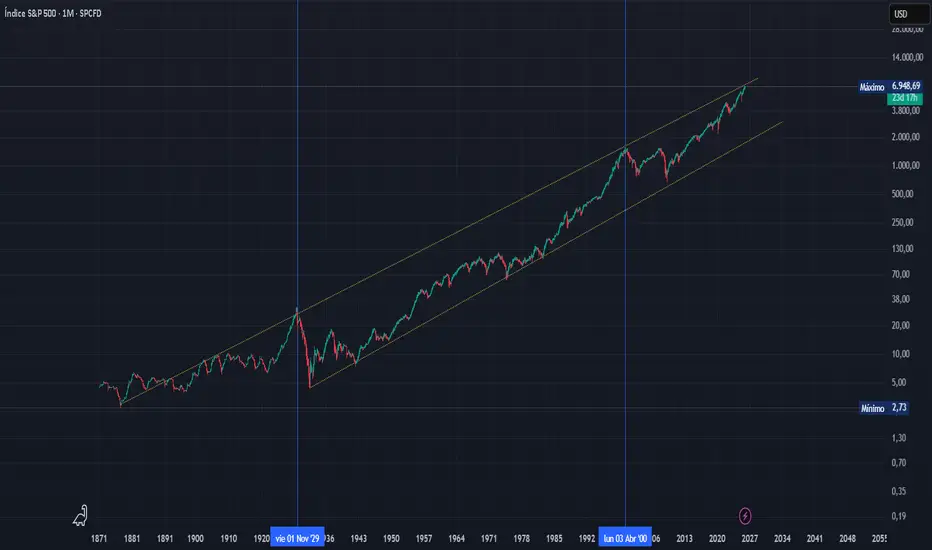
S&P 500 Monthly – Historical Logarithmic Chart –
The S&P 500 is approaching long-term resistance seen in 1929 and 2000.
In log scale, this represents limits to sustained percentage growth, highlighting elevated valuations and potential caution.
Historically, similar levels have led to deep corrections, sideways consolidation, or rare breakouts.
Key takeaway : At this stage, disciplined caution and selective positioning tend to generate better long-term alpha than chasing broad market gains.
면책사항
해당 정보와 게시물은 금융, 투자, 트레이딩 또는 기타 유형의 조언이나 권장 사항으로 간주되지 않으며, 트레이딩뷰에서 제공하거나 보증하는 것이 아닙니다. 자세한 내용은 이용 약관을 참조하세요.
면책사항
해당 정보와 게시물은 금융, 투자, 트레이딩 또는 기타 유형의 조언이나 권장 사항으로 간주되지 않으며, 트레이딩뷰에서 제공하거나 보증하는 것이 아닙니다. 자세한 내용은 이용 약관을 참조하세요.