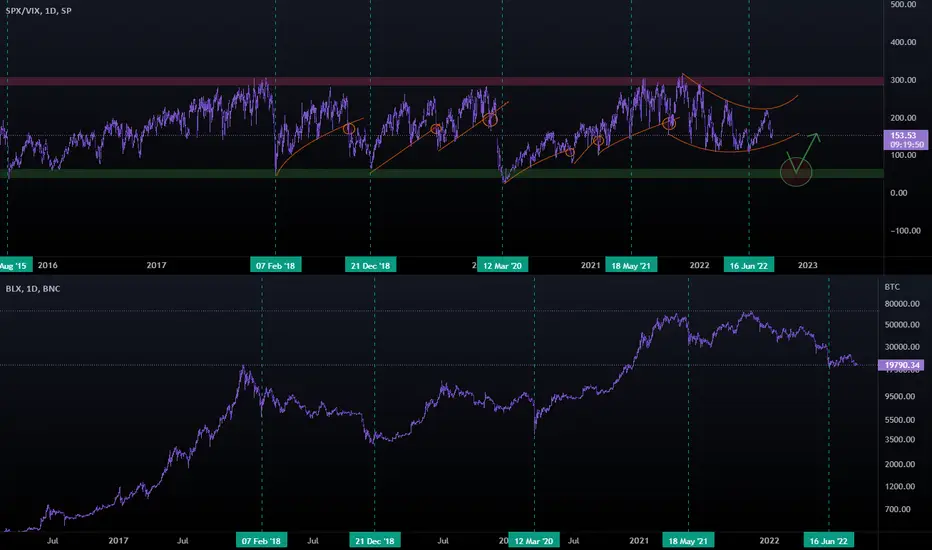
SPX/VIX has been signaling all the best buys and sells for the past few years and it will be a very crutial chart to look at when willing to invest. Here we can see all trends reversals according to stocks and markets sentiment. All touches of the green area have been a great buy opportunity and as you can see - we are nowhere near it yet - sentiment is still heading there.
Right now moving in a curvy channel reversing to the upside - we need to monitor if the chart will bounce within that channel up, or cross it.
Crossing it down will signal a strong bearish momentum and we should act accordingly.
All SPX/VIX dips are marked on BTC aswell - you don't want to miss it.
Right now moving in a curvy channel reversing to the upside - we need to monitor if the chart will bounce within that channel up, or cross it.
Crossing it down will signal a strong bearish momentum and we should act accordingly.
All SPX/VIX dips are marked on BTC aswell - you don't want to miss it.
면책사항
이 정보와 게시물은 TradingView에서 제공하거나 보증하는 금융, 투자, 거래 또는 기타 유형의 조언이나 권고 사항을 의미하거나 구성하지 않습니다. 자세한 내용은 이용 약관을 참고하세요.
면책사항
이 정보와 게시물은 TradingView에서 제공하거나 보증하는 금융, 투자, 거래 또는 기타 유형의 조언이나 권고 사항을 의미하거나 구성하지 않습니다. 자세한 내용은 이용 약관을 참고하세요.