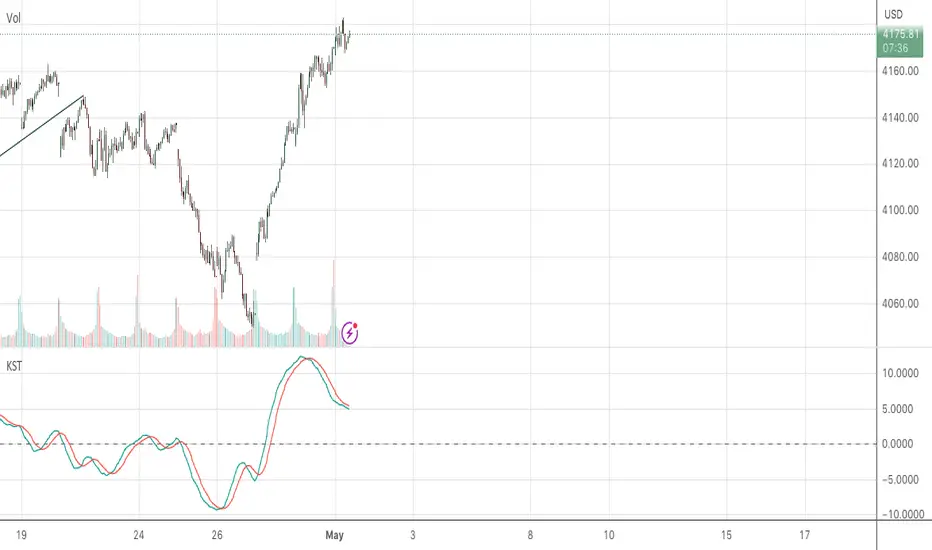
Note the "short term sell signal" rendered this morning
by the KST Indicator on the 15 Minute S+P 500 (Chart Included Here )
Upon looking, you can "see" the KST crossing and then rolling over,
PRIOR to the SPX price peak of 4182.74 this morning.
You had a clue the rally might not last
There was an obvious bearish divergence setting up in the indicator.
Short-Term traders should watch KST closely, especially in 15 Minute Intervals
as moves like this mornings "quick pop and burst " after the NYSE Open
are what makes the KST Indicator so highly respected by traders looking to make money.
SPX NOON OPEN 4174.53
THE_UNWIND
WOODS OF CONNECTICUT
면책사항
이 정보와 게시물은 TradingView에서 제공하거나 보증하는 금융, 투자, 거래 또는 기타 유형의 조언이나 권고 사항을 의미하거나 구성하지 않습니다. 자세한 내용은 이용 약관을 참고하세요.
면책사항
이 정보와 게시물은 TradingView에서 제공하거나 보증하는 금융, 투자, 거래 또는 기타 유형의 조언이나 권고 사항을 의미하거나 구성하지 않습니다. 자세한 내용은 이용 약관을 참고하세요.