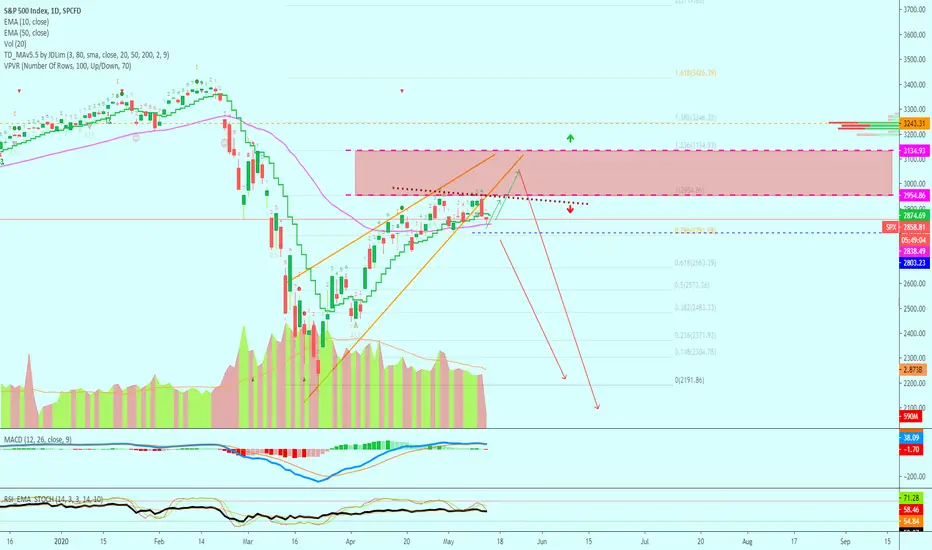
The falling wedge we saw recently on the SPX (S&P 500 Index) has been broken... Below the SPX chart signals
- We now have prices trading below EMA10 and bouncing of EMA50.
- The MACD is showing a bearish cross while it starts to trend down.
- The trading volume continues to go lower, which is a bearish signal.
- We also have a lower high yesterday compared to the 29th of April.
These are the signals coming from this chart, which are mostly bearish.
If EMA50 holds (2838.53), prices can bounce, but when this level breaks it can go straight down.
Here is my previous analysis...
You can hit LIKE to help us grow... To show your support.
Thanks again.
Namaste.
Namaste.
🚨 LIFETIME (Pay 1, Get 7)
lamatrades.com —Since 2017
🚨 Results
ETH +2150%
CRO +1272%
AAVE +1134%
DOGS +868%
SOL +861%
XRP +749%
BTC +580%
t.me/masteranandatrades/6681
😱 Wow & New Results
t.me/anandatrades/1350
lamatrades.com —Since 2017
🚨 Results
ETH +2150%
CRO +1272%
AAVE +1134%
DOGS +868%
SOL +861%
XRP +749%
BTC +580%
t.me/masteranandatrades/6681
😱 Wow & New Results
t.me/anandatrades/1350
면책사항
이 정보와 게시물은 TradingView에서 제공하거나 보증하는 금융, 투자, 거래 또는 기타 유형의 조언이나 권고 사항을 의미하거나 구성하지 않습니다. 자세한 내용은 이용 약관을 참고하세요.