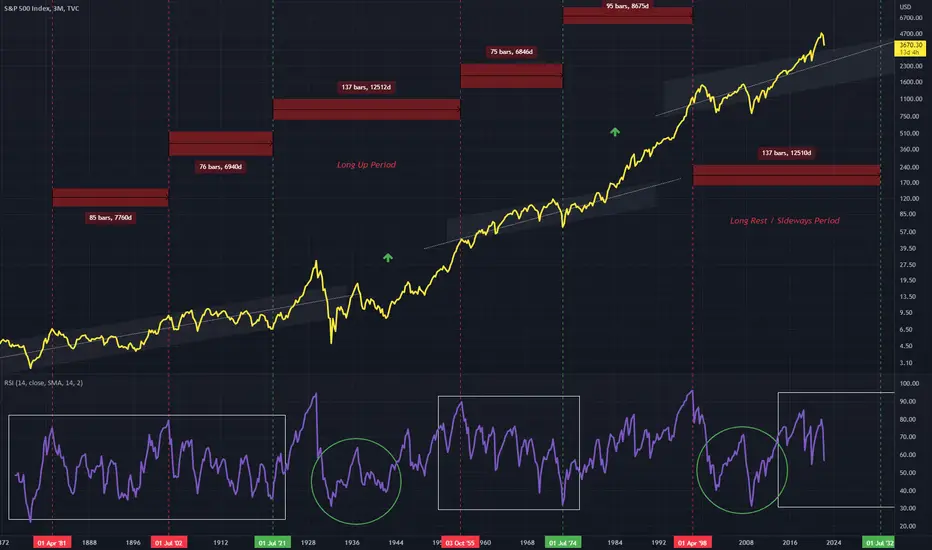
Two periods can be observed on the RSI for SPX on this 3Monthly chart
A downward trend which correlates with a sideways move on the relative timeframe
And a small uptrend that correlates with sharper growth on the SPX, these begin within the green circle
These green circles show very comparative structures, however one is during an up period, while the current one is during a sideways trend period
Price will very likely continue through the up channel on this larger timeframe
면책사항
이 정보와 게시물은 TradingView에서 제공하거나 보증하는 금융, 투자, 거래 또는 기타 유형의 조언이나 권고 사항을 의미하거나 구성하지 않습니다. 자세한 내용은 이용 약관을 참고하세요.
면책사항
이 정보와 게시물은 TradingView에서 제공하거나 보증하는 금융, 투자, 거래 또는 기타 유형의 조언이나 권고 사항을 의미하거나 구성하지 않습니다. 자세한 내용은 이용 약관을 참고하세요.