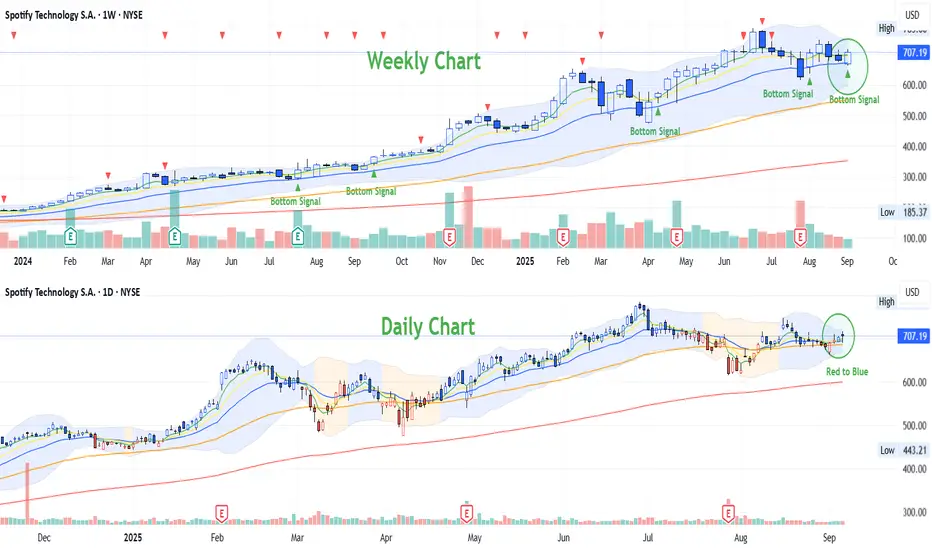
Weekly Chart: Bottom Signal is triggered on this week (week1 of September). Is this mean the consolidation will be done on September? And the long term uptrend will be continued? Based on the historical data, whenever the bottom signal was appeared, there was the beginning of the new wave..
Daily Chart: Red candlestick just turn to Blue Candlestick in Blue Zone. The system is telling us maybe this is just a beginning of another uptrend wave.
Let's monitor this long term uptrend stock from today onwards. :)
Daily Chart: Red candlestick just turn to Blue Candlestick in Blue Zone. The system is telling us maybe this is just a beginning of another uptrend wave.
Let's monitor this long term uptrend stock from today onwards. :)
면책사항
이 정보와 게시물은 TradingView에서 제공하거나 보증하는 금융, 투자, 거래 또는 기타 유형의 조언이나 권고 사항을 의미하거나 구성하지 않습니다. 자세한 내용은 이용 약관을 참고하세요.
면책사항
이 정보와 게시물은 TradingView에서 제공하거나 보증하는 금융, 투자, 거래 또는 기타 유형의 조언이나 권고 사항을 의미하거나 구성하지 않습니다. 자세한 내용은 이용 약관을 참고하세요.