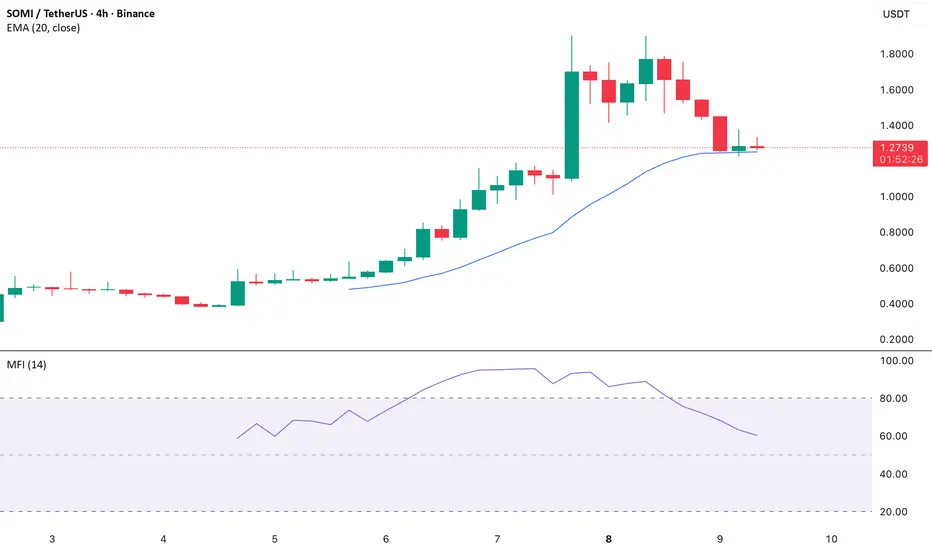
On the SOMI/USD four-hour chart, the Money Flow Index (MFI) has been trending downward, indicating a rise in selloffs. Since the MFI accounts for both price and volume, a decline confirms that sellers are steadily gaining control while buyers lose momentum.
SOMI’s recent price action has brought it closer to the 20-day Exponential Moving Average (EMA), underscoring fading buy-side strength. The EMA serves as a key gauge of short-term market sentiment—trading above it signals sustained bullishness, while a breakdown below suggests a bearish shift.
If SOMI closes decisively below the 20-day EMA, it would signal a move away from the token’s early post-launch optimism toward a more bearish phase. Such a breakdown could invite heavier selling pressure, paving the way for deeper losses ahead.
Truly Unbiased Cryptocurrency News beincrypto.com
면책사항
이 정보와 게시물은 TradingView에서 제공하거나 보증하는 금융, 투자, 거래 또는 기타 유형의 조언이나 권고 사항을 의미하거나 구성하지 않습니다. 자세한 내용은 이용 약관을 참고하세요.
Truly Unbiased Cryptocurrency News beincrypto.com
면책사항
이 정보와 게시물은 TradingView에서 제공하거나 보증하는 금융, 투자, 거래 또는 기타 유형의 조언이나 권고 사항을 의미하거나 구성하지 않습니다. 자세한 내용은 이용 약관을 참고하세요.