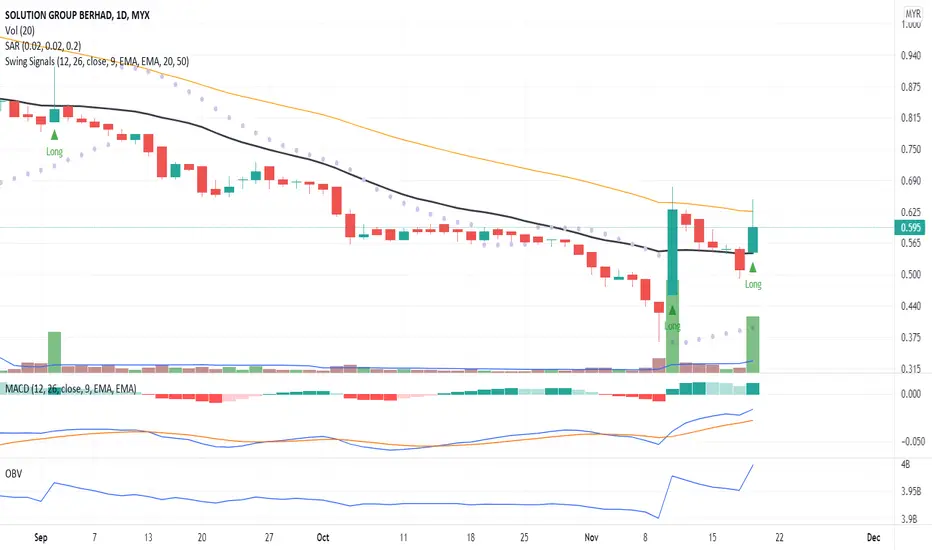
The trend is in a reversal signal when the candlestick body closed above MA20 with high volume confirmed a buying interest by traders. From the Fibonacci Retracement chart, the trend line confirmed the price rebound from the support line.
MACD and OBV charts indicate an early stage of divergence signal. Therefore, precaution is required where the price probability may decline below MA20 with low volume.
Put SOLUTN in your WL and watch out for significant price movement with volume.
R 0.675
S 0.540
MACD and OBV charts indicate an early stage of divergence signal. Therefore, precaution is required where the price probability may decline below MA20 with low volume.
Put SOLUTN in your WL and watch out for significant price movement with volume.
R 0.675
S 0.540
관련 발행물
면책사항
이 정보와 게시물은 TradingView에서 제공하거나 보증하는 금융, 투자, 거래 또는 기타 유형의 조언이나 권고 사항을 의미하거나 구성하지 않습니다. 자세한 내용은 이용 약관을 참고하세요.
면책사항
이 정보와 게시물은 TradingView에서 제공하거나 보증하는 금융, 투자, 거래 또는 기타 유형의 조언이나 권고 사항을 의미하거나 구성하지 않습니다. 자세한 내용은 이용 약관을 참고하세요.