Dear Tradingview family,
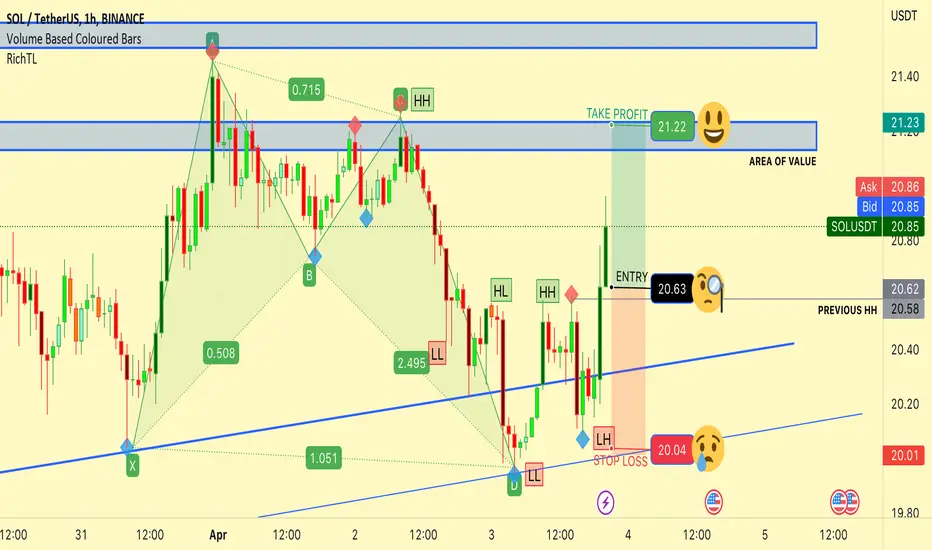
Symbol: #SOL_USDT
Strategy: #HARMONIC_CHART_PATTERN #Trend_REVERSAL #Trendline #Support_Resistance
Indicators: #Price_Action. #Chart_patterns HARMONIC_CHART_PATTERNS, #Trendline #Support_Resistance #RSI #RichTL
Anchor Time: 4 Hours
Trading Time Frame: 1 Hours.
Trade Call Type: #LONG.
Order Type: BUY STOP
Entry: BUY when Price breaks previous Higher High
Entry price: 20.62
Take Profit: 21.23
Stop Loss: 20.01
RRR- 1:1
Methodology:
As a professional and experienced forex, crypto and stocks trader, I will be using a rigorous methodology that involves analyzing the price action and key levels and using a combination of indicators, harmonic chart patterns and chart patterns. I will be looking for potential trendlines , support & resistance levels where the price action may reverse and using our indicators to confirm the validity of our analysis. Based on my analysis, I will then determine the optimal entry and exit points for our trade, as well as the appropriate stop loss level to manage risk.
Conclusion:
Based on our analysis, I believe that there is a potential trading opportunity for a LONG trade.
Risk Assessment:
Conservative Traders risk 0.5% to 1.5%, moderator traders risk 1.6% to 3.5% and aggressive traders risk 3.6% to 5% of their account per trade.
Please use Position size calculator to calculate your risk per trade.
"London-Based Trader | Certified Technical Analyst | Intraday & Scalping Specialist 📈📊 #Forex #Commodities #Indices #Crypto"
면책사항
이 정보와 게시물은 TradingView에서 제공하거나 보증하는 금융, 투자, 거래 또는 기타 유형의 조언이나 권고 사항을 의미하거나 구성하지 않습니다. 자세한 내용은 이용 약관을 참고하세요.
"London-Based Trader | Certified Technical Analyst | Intraday & Scalping Specialist 📈📊 #Forex #Commodities #Indices #Crypto"
면책사항
이 정보와 게시물은 TradingView에서 제공하거나 보증하는 금융, 투자, 거래 또는 기타 유형의 조언이나 권고 사항을 의미하거나 구성하지 않습니다. 자세한 내용은 이용 약관을 참고하세요.