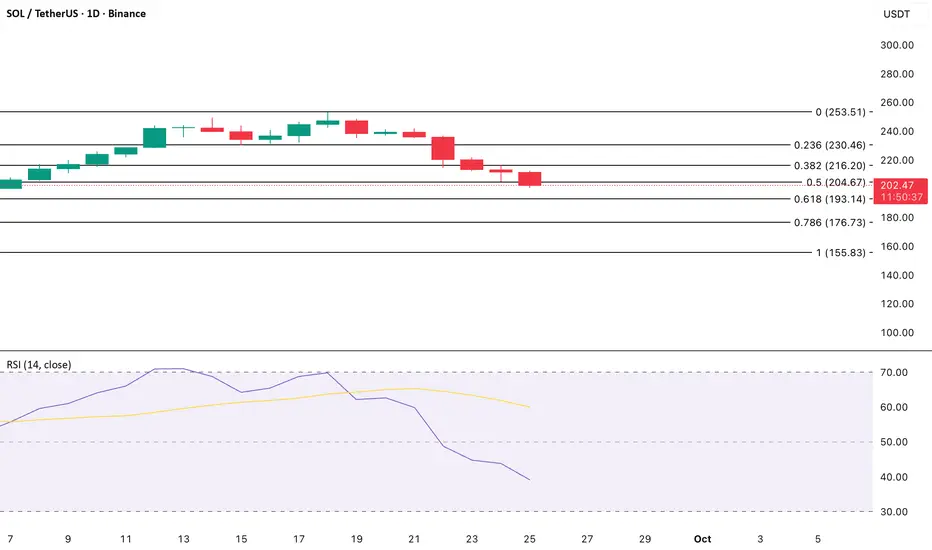
Solana’s daily chart paints a clear picture of weakening demand as its Relative Strength Index (RSI) plunges to 39.07.
The RSI is a momentum indicator that measures overbought and oversold conditions, with levels above 70 reflecting overbought territory and below 30 signaling oversold.
At its current reading, SOL sits firmly in bearish territory, showing that selling pressure is outweighing buying momentum.
While the market may not yet be facing a capitulation phase, the outlook remains tilted to the downside. If bearish sentiment lingers, downward momentum could persist in the near term.
Truly Unbiased Cryptocurrency News beincrypto.com
면책사항
이 정보와 게시물은 TradingView에서 제공하거나 보증하는 금융, 투자, 거래 또는 기타 유형의 조언이나 권고 사항을 의미하거나 구성하지 않습니다. 자세한 내용은 이용 약관을 참고하세요.
Truly Unbiased Cryptocurrency News beincrypto.com
면책사항
이 정보와 게시물은 TradingView에서 제공하거나 보증하는 금융, 투자, 거래 또는 기타 유형의 조언이나 권고 사항을 의미하거나 구성하지 않습니다. 자세한 내용은 이용 약관을 참고하세요.