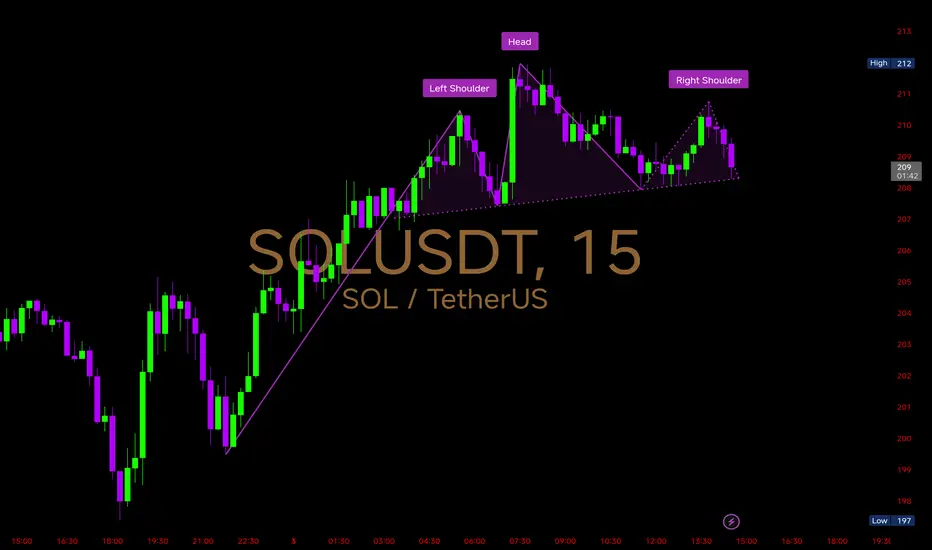
A Head & Shoulders pattern has formed with the left shoulder near 210, head at 212, and right shoulder around 211.
Key Technical Levels
Neckline Support: Around 208 – if this breaks decisively, we could see stronger bearish momentum.
Immediate Resistance: 210–212 (right shoulder + recent high). A breakout above invalidates the bearish pattern.
Downside Targets: If the neckline fails, price could test 205 → 202 → 197 support zones.
Bullish Case: Sustaining above 212 would flip the structure invalid, pushing price back into 215–220 zone.
Right now, #SOLANA is at a critical point – holding above the neckline keeps bulls alive, but losing it confirms a bearish breakdown.
면책사항
이 정보와 게시물은 TradingView에서 제공하거나 보증하는 금융, 투자, 거래 또는 기타 유형의 조언이나 권고 사항을 의미하거나 구성하지 않습니다. 자세한 내용은 이용 약관을 참고하세요.
면책사항
이 정보와 게시물은 TradingView에서 제공하거나 보증하는 금융, 투자, 거래 또는 기타 유형의 조언이나 권고 사항을 의미하거나 구성하지 않습니다. 자세한 내용은 이용 약관을 참고하세요.